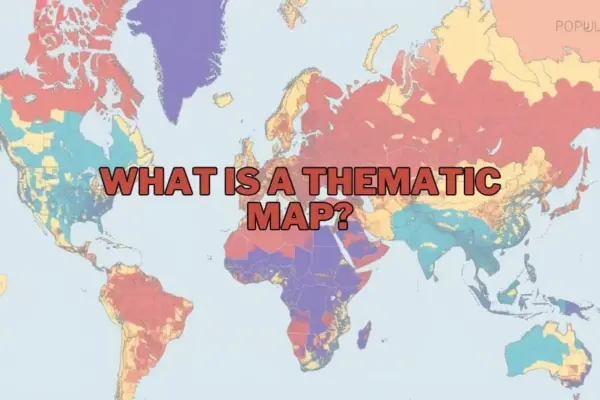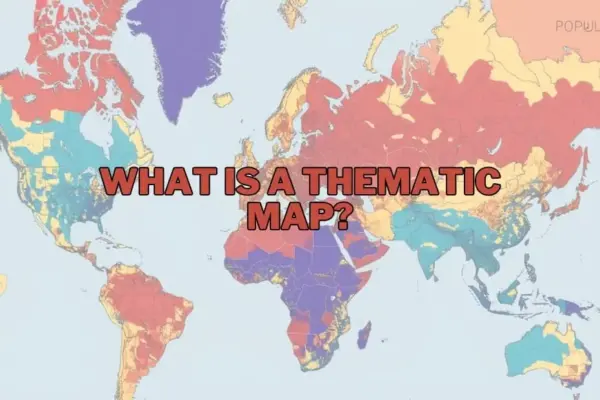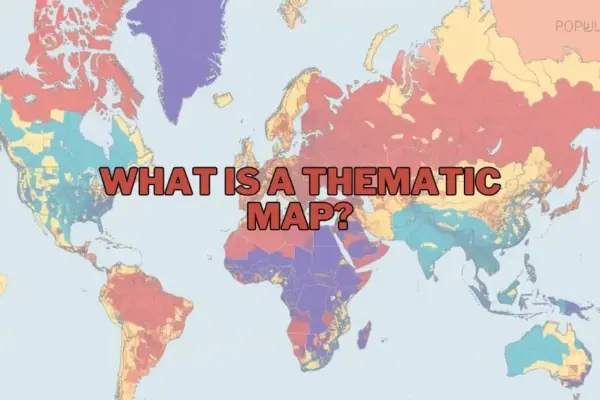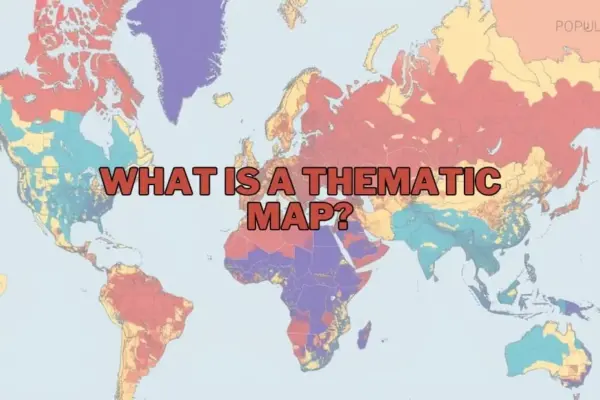
In an era increasingly defined by location-based data and geographic information systems, maps have expanded far beyond their traditional role as tools for navigation. Today, spatial visual tools serve as essential instruments for analytical storytelling, uncovering geographic patterns, and assisting decision-makers in synthesizing complex datasets. Within cartography and data visualization, thematic maps stand out as a specialized, powerful mechanism designed to illustrate specific topics and distributions across defined geographical areas.
Unlike general reference maps—which prioritize physical and infrastructure features like roads, rivers, topographical landmarks, and municipal boundaries—thematic maps emphasize specific subjects or data themes. By overlaying attributes such as population density, climate patterns, or economic performance onto a geographic canvas, thematic maps translate abstract statistical tables into immediate visual insights.
The Definition and Core Function of Thematic Maps
At its core, a thematic map is a specialized map engineered to visualize data related to a chosen topic, variable, or trend across space. Rather than attempting to represent the complete physical topography of a region, a thematic map isolates specific attributes—such as median household income, annual precipitation, or voter turnout—and displays their spatial distribution using distinct visual cues such as color gradients, proportional symbols, or shading variations.
While a reference map answers the fundamental question of "Where is a feature located?", a thematic map answers "How is a specific phenomenon distributed across space?" This distinction renders thematic maps indispensable for geographers, data analysts, urban planners, public health officials, and policymakers. By converting raw numerical datasets into spatial visuals, these maps allow users to quickly identify regional disparities, geographic clusters, and unexpected outliers that might otherwise remain hidden within spreadsheets.
For instance, a thematic map tracking regional rainfall can instantly reveal agricultural drought risks, while a map depicting local unemployment rates can guide state authorities in directing economic development funds toward targeted communities.
Purpose and Importance of Thematic Maps
The primary purpose of thematic cartography is effective spatial communication. In a world saturated with information, thematic maps simplify dense structural data without sacrificing geographical context. They enable researchers and organizations to model relationships between spatial environments and human or physical activities.
The importance of thematic maps spans across multiple disciplines:
- Environmental Policy and Climate Research: Thematic mapping plays a vital role in illustrating environmental shifts, such as tracking deforestation rates, marine temperature variations, or urban heat island effects. Visualizing these factors enables scientists and legislators to evaluate how changing climate conditions affect agricultural productivity and natural ecosystems.
- Urban and Regional Infrastructure: Municipal planners rely heavily on thematic visualizations to assess population growth, transit accessibility, and housing distribution, ensuring that infrastructure investments match local demographic needs.
- Economic Strategy and Commerce: Businesses leverage thematic spatial analysis to evaluate market penetration, evaluate regional purchasing power, and determine optimal supply chain routes or retail storefront locations.
By transforming abstract data into visual stories, thematic maps democratize complex research, allowing non-specialist stakeholders and the public to grasp critical spatial insights quickly.
Types of Thematic Maps
Cartographers utilize a variety of thematic mapping techniques depending on the nature of the data being evaluated—whether qualitative or quantitative, discrete or continuous. Understanding these distinct formats is critical for effectively communicating data relationships.
Choropleth Maps
Choropleth maps are among the most common thematic formats. They utilize varying color tones or shading intensities within predefined geographic boundaries—such as countries, states, counties, or zip codes—to represent aggregate statistical values. For example, a choropleth map might display population density per square kilometer, with darker shades representing higher concentrations of residents. These maps are ideal for categorical data or continuous datasets that have been grouped into specific administrative units.
Isoline (Isarithmic) Maps
Isoline maps use continuous lines to connect geographic points that share equal numerical values. These maps are particularly useful for visualizing smooth, continuous variables that transition fluidly across terrain without regard to administrative borders. Common examples include weather maps displaying isotherms (lines of equal temperature) or isohyets (lines of equal rainfall), as well as topographic maps utilizing contour lines to represent elevation.
Proportional and Graduated Symbol Maps
Proportional symbol maps place visual symbols—such as circles, squares, or icons—at specific geographic points or area centroids. The visual size of each symbol scales directly in proportion to the value of the data point being represented. For example, a proportional symbol map might depict major metropolitan airports, using larger circles to represent higher annual passenger volumes. This format allows analysts to compare quantitative totals at precise locations without distorting underlying geographic boundaries.
Dot Density Maps
Dot density maps use uniform point symbols to visually represent the presence, quantity, or frequency of a specific phenomenon across a geographic region. Each dot can represent a single unit (such as one individual event) or a designated aggregate quantity (such as 1,000 residents). As dot concentration increases within a region, visual density increases, offering an intuitive representation of population dispersion, species distribution, or crime occurrence.
Cartograms
Cartograms intentionally distort traditional geographic space and land area based on a designated thematic variable. In a cartogram, the geometric size of a country or region expands or shrinks proportionally according to the data value being mapped—such as national gross domestic product (GDP) or total energy consumption—rather than its actual physical land mass. This dramatic visual distortion highlights global or regional imbalances that standard geographic maps might obscure.
Key Elements of a Thematic Map
Creating an accurate and readable thematic map requires careful attention to essential design principles and map elements. Without proper layout and cartographic context, spatial data can easily be misinterpreted.
- A clear, informative title specifies the map’s focus, geography, and timeframe, providing immediate context for the reader.
- Legend or Key: The legend defines the visual language of the map, explaining what specific colors, shading gradients, line weights, or symbols represent in terms of numerical values or qualitative categories.
- Map Scale: A graphic or numerical scale reference allows readers to understand real-world distances and geographic proportions accurately.
- Data Source Attribution: Citing credible data sources—such as census bureaus, meteorological organizations, or government repositories—establishes institutional authority and allows users to verify accuracy.
- Color Palette and Visual Hierarchy: Effective color choices ensure data readability. Sequential color schemes (light to dark) effectively represent ordered quantitative data, while qualitative color schemes (distinct hues) delineate non-numerical categorical differences.
- Orientation Indicator: A standard directional marker, such as a compass rose or north arrow, provides visual spatial orientation.
Applications Across Diverse Sectors
The utility of thematic cartography extends well beyond traditional geography departments, playing an active role in strategic operations across public and private sectors:
- Public Health and Epidemiology: Health officials utilize thematic maps to track disease outbreaks, monitor vaccination coverage, and identify communities with limited access to medical infrastructure.
- Resource and Environmental Management: Forestry services and conservation groups map forest canopy loss, wildfire risk zones, and wildlife corridors to target environmental protection initiatives.
- Public Safety and Emergency Services: Law enforcement and emergency management agencies map crime hotspots, flood hazard zones, and response times to optimize patrol deployments and disaster response routes.
- Commercial Real Estate and Retail Analytics: Commercial enterprises combine demographic data with trade-area maps to analyze consumer behavior, evaluate competitor density, and select viable commercial sites.
Advantages and Benefits
Thematic maps provide distinct analytical benefits over traditional statistical tables and text-heavy summaries:
- Rapid Visual Processing: Human cognition processes visual patterns significantly faster than raw tabular data, enabling rapid identification of spatial trends and regional disparities.
- Contextual Data Integration: By overlaying data onto geography, thematic maps highlight how physical landscape features, political borders, and spatial proximity influence real-world outcomes.
- Enhanced Decision-Making: Clear spatial visuals help policy leaders and business executives quickly spot underserved areas, direct resources effectively, and communicate complex strategies to stakeholders.
Limitations and Potential Drawbacks
While thematic maps are highly effective analytical tools, cartographers and decision-makers must account for inherent design limitations:
- Data Aggregation and Generalization: Grouping data into large administrative zones (such as whole states or countries) can obscure localized variations within those boundaries—a phenomenon known as spatial generalization.
- Visual Bias and Misinterpretation: Inappropriate scale selection, poor color choices, or misleading data classification schemes (such as flawed quantitative binning) can distort map output and mislead viewers.
- Dependence on Baseline Accuracy: A thematic map is only as reliable as its underlying spatial and statistical datasets. Outdated or inaccurate census and geospatial data will yield flawed map outputs.
Tools and Software for Creating Thematic Maps
Modern cartography offers a wide range of specialized software applications, catering to both novice mappers and advanced spatial data scientists:
- QGIS: A widely adopted, free, and open-source Geographic Information System (GIS) offering advanced thematic mapping features, extensive plugin ecosystems, and robust vector/raster analysis tools.
- ArcGIS (Esri): The industry-standard commercial GIS software suite, providing comprehensive spatial analytics, advanced visualization options, and cloud-enabled mapping capabilities for enterprise applications.
- Tableau: A leading business intelligence platform that seamlessly integrates basic thematic mapping capabilities directly into corporate analytics dashboards.
- Web Mapping Frameworks: Tools such as Mapbox, Leaflet, and Google Earth Engine enable developers to build interactive, web-based thematic maps designed for dynamic user engagement and large-scale web deployment.
Frequently Asked Questions
What is the difference between a thematic map and a reference map?
Thematic maps concentrate on displaying the spatial distribution of a specific theme, variable, or statistical dataset—such as population density, income levels, or annual rainfall. In contrast, reference maps display general geographic features, including physical terrain, road networks, water bodies, and political boundaries, primarily serving navigational and locational purposes.
Can thematic maps be used for historical data?
Yes, thematic maps are widely used to illustrate historical patterns and geographic shifts over time. They can model historical population movements, changes in territorial control, past industrial expansions, or long-term climate alterations across historical eras.
What software is best for beginners to create thematic maps?
For beginners entering cartography and spatial data visualization, QGIS offers a free, open-source platform with extensive online community support and tutorials. Additionally, business intelligence tools like Tableau provide intuitive, drag-and-drop interfaces for creating basic thematic maps without requiring extensive technical GIS training.
How do I choose the right type of thematic map for my data?
Selecting the appropriate thematic map depends on the characteristics of your dataset. Continuous data that flows across geographic boundaries (such as elevation or temperature) is best represented using isoline maps. Aggregated quantitative data linked to predefined administrative regions (such as census population counts per county) works best with choropleth maps. When mapping precise point locations or localized counts, proportional symbol or dot density maps are recommended.
Are thematic maps only used in geography?
No, thematic maps are extensively utilized across a broad range of non-geographic industries, including healthcare epidemiology, commercial retail strategy, real estate investment, public policy administration, urban planning, and environmental management.