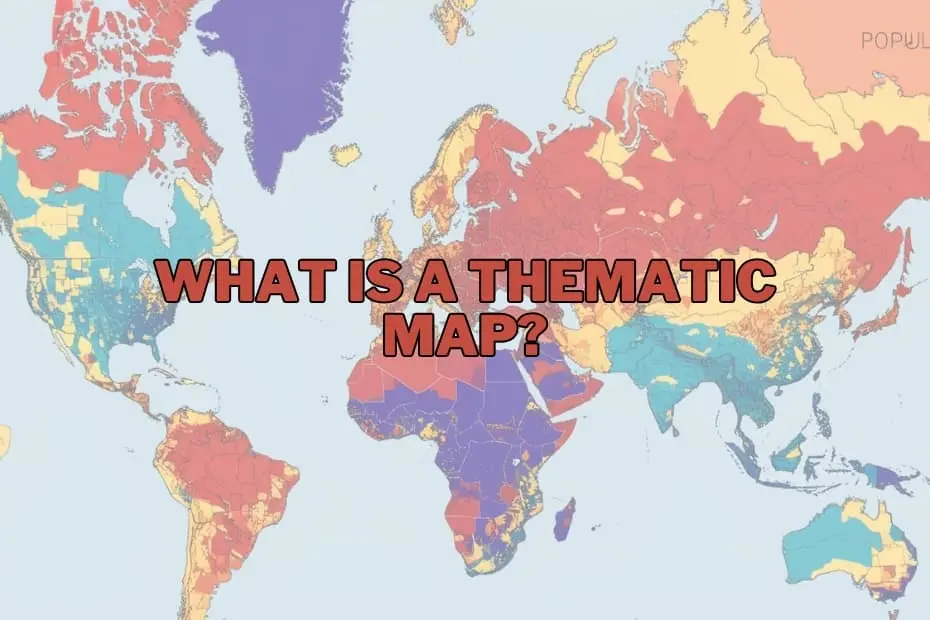
In the modern era of big data, society is inundated with information. From population shifts and climate fluctuations to economic trends and public health metrics, the sheer volume of data generated daily can be overwhelming. In the fields of geography, urban planning, and data science, maps have evolved far beyond simple navigational aids. They have become sophisticated, indispensable instruments for telling stories, uncovering hidden patterns, and translating complex spatial datasets into actionable insights.
Among the diverse tools available to cartographers and data analysts, thematic maps stand out as a unique and invaluable resource. While standard maps tell us where things are, thematic maps show us how things are distributed, revealing the underlying patterns of our world. Understanding the mechanics, applications, advantages, and limitations of thematic maps is crucial for anyone looking to navigate the modern landscape of spatial data visualization.
Defining the Thematic Map: More Than Just Geography
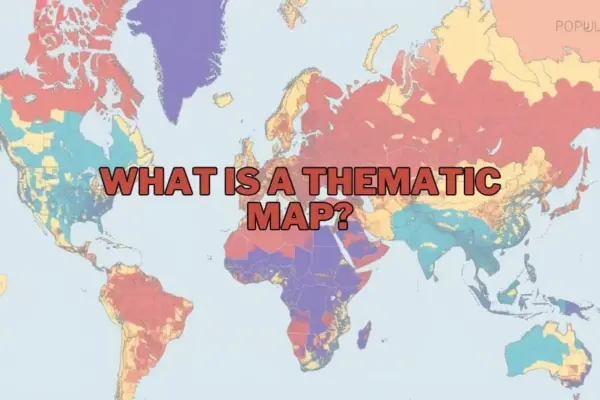
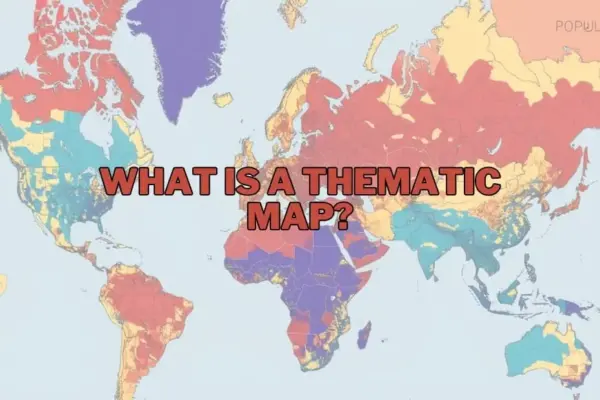
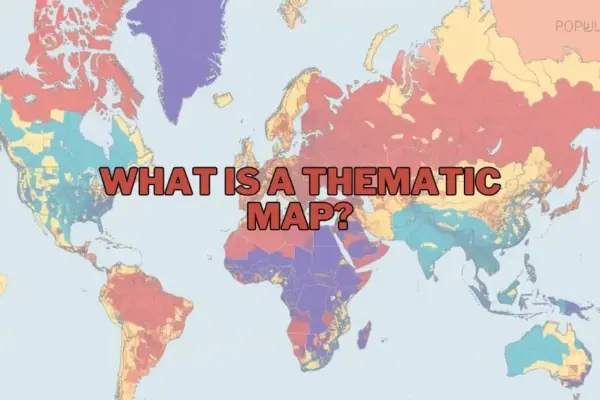
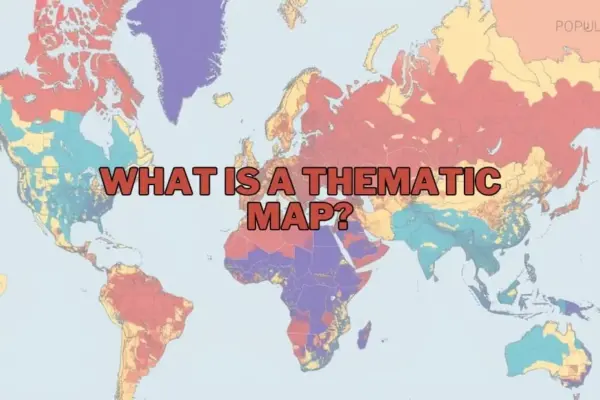
A thematic map is a specialized map designed to visualize specific data themes or subject matters connected to geographic locations. Unlike general reference maps—such as road maps or topographic maps, which emphasize physical and human-made features like highways, rivers, and cities—thematic maps prioritize a single topic or a group of related topics.
Whether illustrating population density, average annual rainfall, or regional economic output, a thematic map uses visual variables like color gradients, patterns, and symbols to highlight how a specific phenomenon varies across a geographic area.
By stripping away unnecessary geographic details and focusing on a singular theme, these maps transform abstract, spreadsheet-bound data into intuitive visual narratives. They allow geographers, researchers, policymakers, and the general public to immediately identify spatial anomalies, concentrations, and trends that would otherwise remain hidden in raw data tables.
Purpose and Importance: Why Spatial Context Matters
The primary purpose of a thematic map is to communicate complex spatial relationships clearly and efficiently. Humans are inherently visual creatures, and we are wired to recognize patterns in shapes and colors much faster than in rows of numbers. A well-crafted thematic map leverages this cognitive strength, allowing viewers to synthesize vast amounts of geographic information almost instantly.
The importance of these maps spans across numerous critical disciplines:
- Environmental Analysis: Thematic maps play a vital role in demonstrating how climate change impacts agricultural productivity, tracing shifts in vegetation zones, or mapping the spread of invasive species.
- Urban and Regional Planning: Municipalities rely on spatial data to understand how population growth affects infrastructure, zoning laws, and public utility distribution.
- Economic Policy: By mapping indicators such as regional unemployment, household income, or industrial output, policymakers can visually assess economic disparities and direct resources to areas that need them most.
In essence, thematic maps democratize data. They bridge the gap between technical spatial analysis and public understanding, providing a common visual language that aids in collaborative decision-making.
The Diverse Palette of Spatial Visualization: Types of Thematic Maps
Cartographers employ several distinct styles of thematic maps, choosing the format that best fits the nature of the data and the story they need to tell.
Choropleth Maps
The choropleth map is perhaps the most widely recognized type of thematic map. It uses progressive color shading, patterns, or tints within predefined administrative boundaries—such as countries, states, or zip codes—to represent different values of a spatial variable. For example, a choropleth map might show population density by state, with darker shades of blue representing higher concentrations of people and lighter shades representing sparser regions. While highly effective for showing regional distributions, choropleth maps can sometimes mislead viewers by implying that an entire administrative zone has uniform data characteristics, ignoring local variations within those boundaries.
Dot Density Maps
Dot density maps use individual dots to represent a specific quantity of a phenomenon. Each dot is assigned a value (for instance, one dot equals 1,000 households), and the dots are plotted across the geographic area. The visual density of the dots creates a clear picture of spatial concentration and dispersion. This approach is highly effective for visualizing population distribution, agricultural production, or resource allocation without the rigid constraints of colored administrative boundaries.
Proportional and Graduated Symbol Maps
When mapping raw, absolute values rather than ratios or densities, proportional symbol maps are highly effective. These maps place symbols—typically circles, squares, or custom icons—over specific geographic points or regions, scaling the size of the symbol in direct proportion to the data value it represents. A map tracking the total population of major global cities, for example, would display massive circles over megacities like Tokyo and Delhi, and significantly smaller circles over mid-sized urban centers.
Isoline (Isarithmic) Maps
Isoline maps are designed to represent continuous surfaces of data where values transition smoothly from one point to another, rather than stopping abruptly at political borders. These maps connect points of equal value using continuous lines, known as isolines. Common examples include topographic maps showing elevation contours, weather maps displaying temperature gradients (isotherms), or atmospheric pressure maps (isobars). Isoline maps are essential for environmental sciences, where natural phenomena do not conform to human-drawn boundaries.
Cartograms
A cartogram is a unique and striking thematic map that intentionally distorts geographic shape and size to reflect a specific variable. Instead of scaling landmass by physical square miles, a cartogram might scale the size of countries based on their gross domestic product (GDP) or total population. The result is a highly distorted, yet incredibly powerful, visual representation that immediately emphasizes global imbalances and structural disparities.
The Essential Elements of a High-Quality Thematic Map
To ensure a thematic map is both accurate and easy to interpret, cartographers must carefully design several fundamental elements:
- The Map A clear, descriptive title is essential. It must instantly inform the viewer of what theme is being visualized, the geographic scope, and the time frame of the data.
- The Legend: Often considered the most critical component of a thematic map, the legend acts as the translator. It defines what each color, symbol size, shading pattern, or line represents, enabling the viewer to accurately decode the map’s quantitative and qualitative values.
- Data Classification and Symbology: The way data is grouped into classes (such as equal intervals, quantiles, or natural breaks) heavily influences the map’s visual impact. Cartographers must choose classification methods and color schemes that represent the data honestly without exaggerating or minimizing trends.
- Map Projections and Scale: Because the Earth is a three-dimensional sphere, flattening it onto a two-dimensional map requires a map projection. The choice of projection is crucial in thematic mapping; for instance, an equal-area projection is vital when mapping spatial densities, as distorting the physical size of regions would distort the viewer’s perception of the data.
- Metadata and Data Sources: Credibility is key in journalism and scientific research. A professional thematic map must clearly state the source of its data and the year it was collected, allowing viewers to verify the information and understand its context.
Practical Applications Across Modern Industries
The utility of thematic mapping extends far beyond academic geography, serving as a cornerstone for strategic operations in various sectors.
In public health, thematic mapping is a primary tool for epidemiologists. By mapping disease outbreaks, vaccination rates, and access to healthcare facilities, medical professionals can track the spread of pathogens, identify vulnerable populations, and coordinate rapid response efforts.
In business and market research, corporations utilize thematic maps for site selection, target demographic profiling, and supply chain logistics. Mapping consumer purchasing power, competitor locations, and regional preferences allows businesses to make data-driven expansion decisions and optimize their marketing campaigns.
In environmental conservation and forestry, researchers use these maps to monitor deforestation, track wildlife migration patterns, assess wildfire risks, and map the health of marine ecosystems. This spatial intelligence is vital for drafting effective conservation policies and managing natural resources sustainably.
Weighing the Strengths and Weaknesses of Thematic Maps
Like any analytical tool, thematic maps come with distinct advantages and inherent limitations.
Advantages
The primary benefit of thematic maps is their unparalleled ability to simplify complex datasets. They allow for rapid visual comparison, making it easy to spot spatial relationships, clusters, and anomalies that might take hours to identify in a spreadsheet. They are also highly versatile, capable of visualizing qualitative data (such as dominant language groups) and quantitative data (such as average rainfall) with equal efficacy.
Limitations
On the other hand, thematic maps can be prone to unintentional bias or misinterpretation. A major challenge is the Modifiable Areal Unit Problem (MAUP), where changing the boundaries of the analysis areas (e.g., shifting from county-level to state-level data) can drastically alter the resulting spatial patterns.
Additionally, if a cartographer selects inappropriate data classification ranges or misleading color palettes, the map can distort reality, leading viewers to incorrect conclusions. Users must also remember that thematic maps often generalize data, smoothing over local nuances to present a broader regional picture.
The Modern Cartographer’s Digital Toolkit
The process of creating thematic maps has been revolutionized by advanced software and digital tools, transitioning from manual drafting to automated, dynamic generation.
For professional geographers and researchers, Geographic Information Systems (GIS) software like QGIS (an open-source platform) and ArcGIS (the industry standard) offer unparalleled capabilities for spatial analysis, data editing, and cartographic design. These platforms allow users to manipulate massive spatial databases and generate highly customized thematic visualizations.
For business analysts and communication professionals, business intelligence tools like Tableau and Power BI provide intuitive, drag-and-drop interfaces for creating interactive maps. These tools are ideal for integrating corporate data with geographic boundaries without requiring extensive training in spatial science.
Furthermore, programming languages like Python (utilizing libraries such as Geopandas and Folium) and R (with packages like sf and ggplot2) enable data scientists to automate map creation, build interactive web applications, and handle complex spatial statistics programmatically.
Questions and Answers: Understanding Thematic Maps
What is the primary difference between a thematic map and a reference map?
A thematic map is designed to focus on a specific subject or data theme—such as population density, climate patterns, or economic indicators—over a geographic area. In contrast, a reference map focuses on displaying general geographic features, such as roads, political boundaries, coastlines, and physical landforms, primarily to help users navigate or locate places.
Can thematic maps be used to represent historical data?
Yes, thematic maps are highly effective tools for visualizing historical trends and changes over time. By mapping historical census data, shifting political borders, or the progression of past military campaigns, researchers can visually analyze how geographic and demographic patterns have evolved throughout history.
What software options are recommended for beginners who want to create thematic maps?
For beginners, QGIS is an excellent, free, open-source desktop GIS program that offers robust cartographic capabilities. For those looking for more intuitive, business-focused visualizations with minimal learning curves, data visualization platforms like Tableau or web-based mapping applications provide user-friendly drag-and-drop interfaces to generate professional maps quickly.
How do I determine the best type of thematic map for my specific dataset?
The choice depends on the nature of your data. If you are working with continuous, naturally transitioning data (like temperature or elevation), an isoline map is ideal. If you are visualizing data grouped within administrative boundaries (such as literacy rates by country), a choropleth map is highly effective. For raw totals at specific locations (like the population of individual cities), proportional symbol maps are generally the most accurate choice.
Are thematic maps used outside the field of geography?
Thematic maps are widely utilized across a broad range of professional fields. Public health officials use them to track diseases, business analysts use them to identify target demographics, environmental scientists use them to monitor ecosystems, and political scientists use them to analyze voting behaviors and election outcomes.