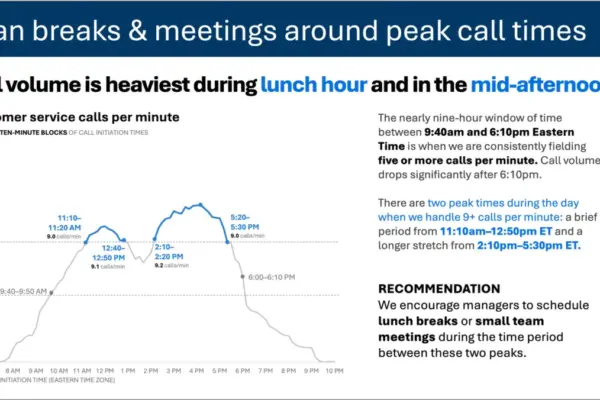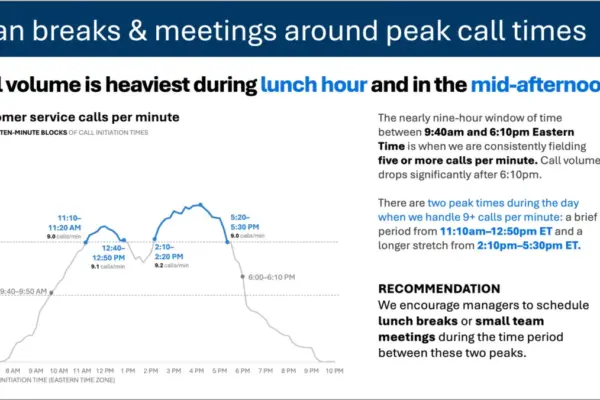
In the modern data-driven workplace, the ability to communicate insights effectively has become a critical competency for professionals across industries. Yet, despite the widespread availability of advanced software tools and artificial intelligence assistants capable of generating complex charts in mere seconds, many organizational communications still suffer from poor visual design. According to data visualization experts, one of the most common pitfalls in corporate reporting is the indiscriminate use of color, which often obscures rather than illuminates key business metrics.
Industry specialists emphasize that color should always be an explicit, purposeful choice rather than a default setting applied automatically by graphing software or generative AI tools. While automated platforms can rapidly assemble charts and occasionally attempt to apply spontaneous highlighting, they fundamentally lack the human context required to determine which specific data points matter most to a given audience. That critical judgment call remains the sole responsibility of the communicator. When used thoughtfully, however, color stands out as one of the most efficient mechanisms available for dramatically improving the readability and impact of a graph.

To illustrate these principles in a practical setting, analysts frequently examine standardized datasets such as year-over-year sales metrics for various cat food brands manufactured by a leading pet product company. Originating from advanced data storytelling exercises, this specific dataset serves as a powerful baseline for exploring how thoughtful formatting can shift an audience’s focus from overwhelming noise to clear, actionable insights. By carefully controlling visual elements, presenters can guide stakeholders directly to the most vital takeaways without requiring verbal walkthroughs.
Establishing a Neutral Foundation in Greyscale
A foundational strategy for effective data visualization involves stripping away software-generated default colors entirely and initiating the design process with a neutral palette of greys. Building a chart in shades of grey serves a dual purpose. First, it establishes a clean, unbiased visual baseline that directs the audience’s attention away from arbitrary rainbow color schemes that carry no inherent meaning. Second, it acts as a psychological reminder to the creator that additional editorial work is required before the graphic is truly ready for professional presentation, making it significantly easier to be deliberate about where color ultimately belongs.
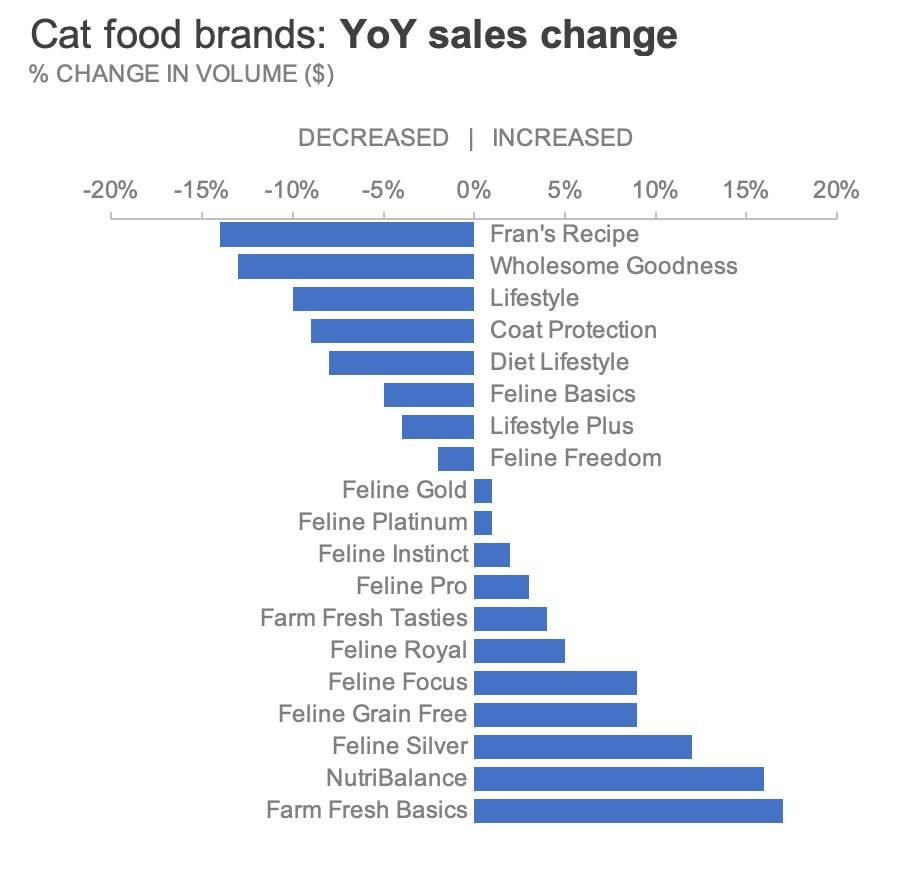
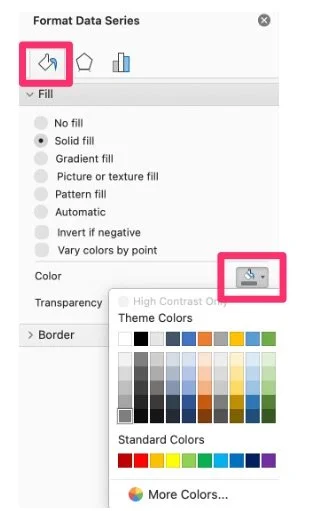
In practical terms, achieving this neutral slate involves replacing standard palette fills with understated neutral tones across all data series. Once a clean greyscale version of a chart has been established, professionals often save the layout as a reusable template to streamline future reporting workflows, eliminating the need to repeatedly execute manual formatting adjustments. This disciplined approach ensures that color, when it is finally introduced, carries maximum communicative weight.
Highlighting Critical Business Signals
Once a neutral greyscale foundation is established, color can be introduced selectively to draw the audience’s attention to specific stories hidden within the data. For instance, in an analysis examining year-over-year sales performance across pet food brands, a communicator might choose to call special attention exclusively to those product lines that experienced a decline in revenue compared to the previous year.
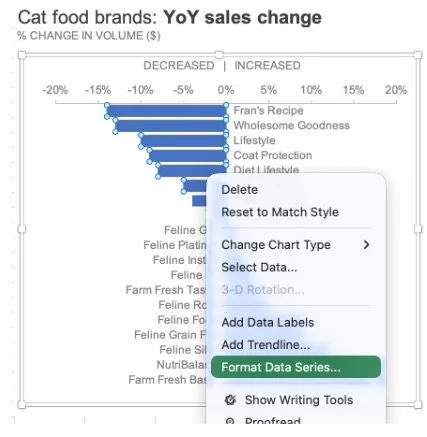
To maintain high standards of visual accessibility, experienced designers often avoid using bright red to signal negative performance, opting instead for a softer orange hue that naturally reinforces a sense of decline without triggering the visual strain associated with harsher tones. By restricting this color application solely to the declining data bars while leaving the growing brands in neutral grey, the visualization instantly communicates which areas require strategic intervention.
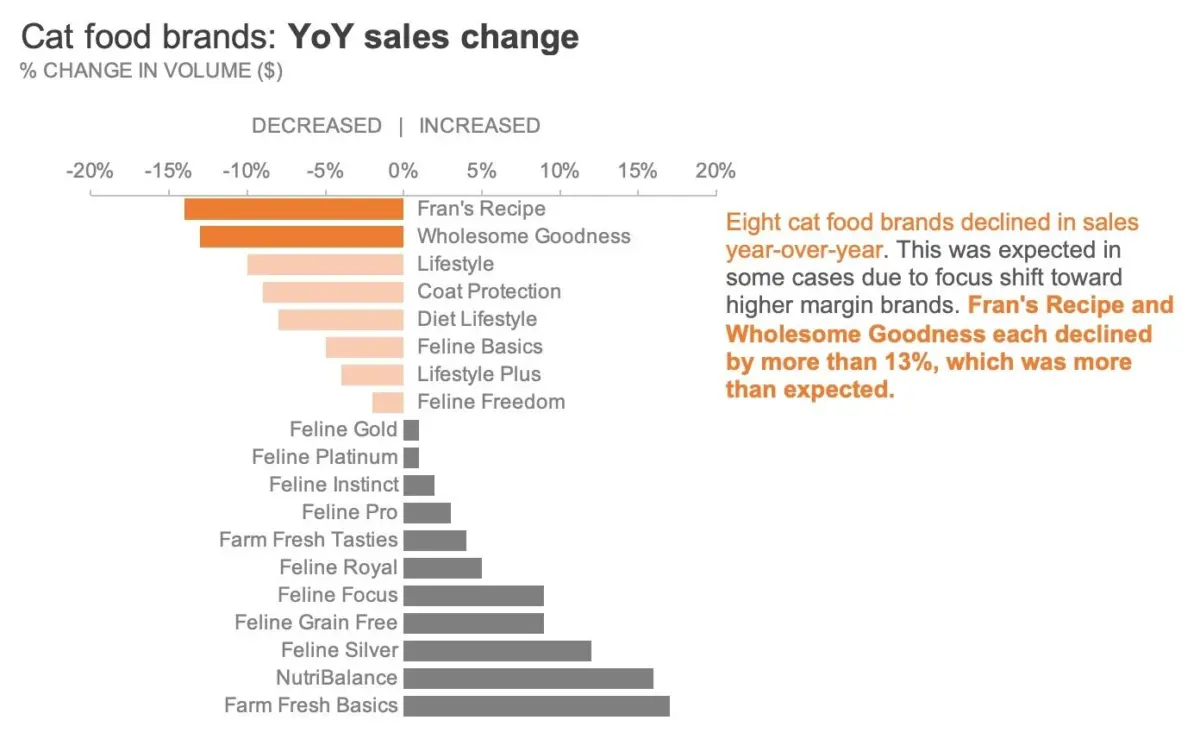
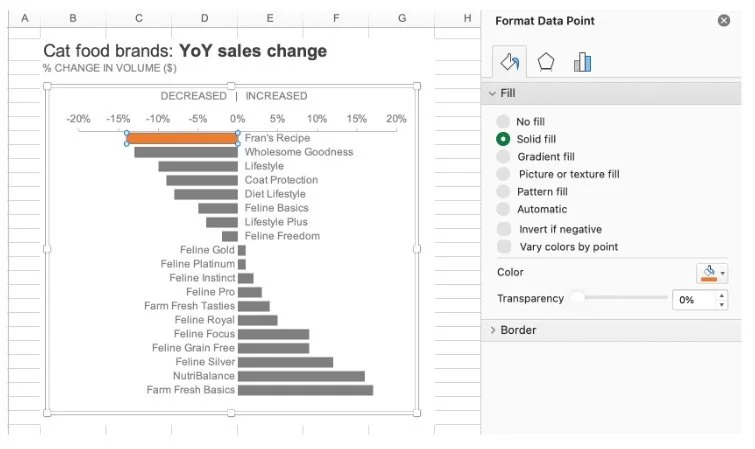
The challenge deepens, however, when an analyst needs to communicate nuance within a subset of declining data. If an audience requires visibility into all underperforming brands, but also needs immediate awareness of the two product lines that suffered the most severe drop—such as specific formulations like Fran’s Recipe and Wholesome Goodness—applying a single flat color across all declining bars can erase that crucial distinction. Flattening the hierarchy would obscure the reality that some products declined only marginally while others plummeted dramatically.
To solve this dilemma without losing the primary signal, visual communication specialists employ techniques that vary color intensity. Rather than abandoning the categorywide highlight, designers can modulate the saturation of the hue, apply calculated transparency levels, or layer subtle visual shapes over the moderately declining bars. These methods allow all underperforming brands to remain visible within the overarching narrative while simultaneously drawing an intensified focus toward the most severe losses.
Pairing Visuals with Explanatory Text
Even the most meticulously designed chart can fall short if it is distributed to an audience that must consume the information independently, without the benefit of a live presenter walking them through the numbers. To bridge this communication gap, data storytelling advocates recommend pairing visual enhancements with concise, targeted explanatory text directly adjacent to the graphic.
By incorporating a well-crafted text annotation next to the chart and mirroring the color of key highlighted keywords to match the visual elements, creators can forge an immediate cognitive link between the written message and the underlying data. This deliberate alignment ensures that even a casual observer can grasp the primary takeaway within seconds of viewing the document. Ultimately, expert practitioners maintain that color must always serve to support the core message rather than distract from the underlying figures, reinforcing the principle that restrained palettes, purposeful highlighting, and clear language remain the hallmarks of exceptional professional communication.