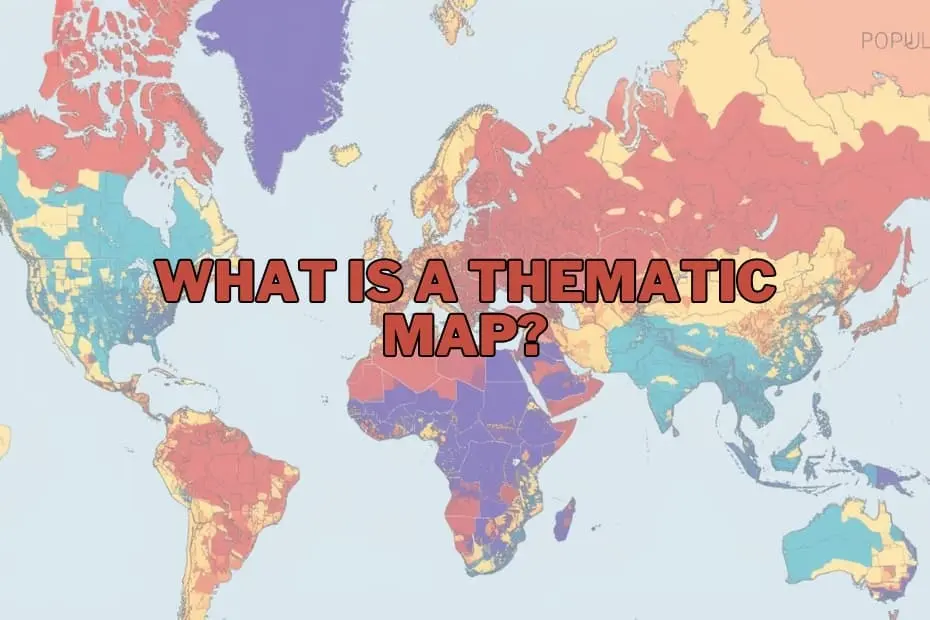
In a world increasingly dominated by vast datasets and complex global challenges, maps have evolved far beyond their traditional role as simple tools for navigation. Today, they serve as sophisticated instruments for telling stories, uncovering hidden patterns, and translating abstract numbers into actionable geographic intelligence. While general reference maps help us find our way from point A to point B, a specialized class of cartography known as thematic mapping has emerged as an indispensable resource for researchers, policymakers, and businesses alike.
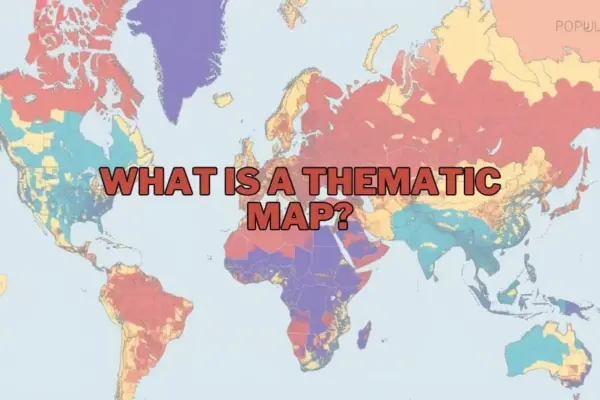
A thematic map is specifically designed to visualize data associated with a particular theme, subject, or concept across a geographic area. Whether illustrating population density, tracking the spread of a virus, or mapping the economic disparities between regions, these maps prioritize spatial patterns and trends over physical landmarks. By utilizing specialized design elements such as color gradients, proportional symbols, and strategic shading, thematic maps distill complex statistical realities into clear visual narratives.
As society grapples with multi-faceted crises ranging from climate change to rapid urbanization, the demand for effective data visualization has never been higher. Understanding the mechanics, applications, and limitations of thematic maps is crucial for anyone looking to navigate the modern data landscape.
The Purpose and Importance of Thematic Maps
The primary objective of a thematic map is to communicate spatial data in a manner that is immediately comprehensible. Raw data presented in spreadsheets or databases can be incredibly difficult to interpret, especially when trying to identify geographic relationships. A thematic map bridges this gap by providing visual context, allowing observers to see not just what is happening, but where it is happening and why those locations matter.
This visual synthesis is critical for discovering underlying correlations that might otherwise remain obscured. For example, by overlaying socio-economic data with environmental variables, researchers can visually demonstrate how climate change disproportionately impacts agricultural productivity in specific latitudes. Similarly, urban planners can use these maps to analyze how population growth correlates with access to public transit or green spaces.
Ultimately, the importance of thematic mapping lies in its power to simplify the complex. By transforming abstract numbers into spatial distributions, these maps provide students, business analysts, environmental scientists, and government officials with the insights needed to make evidence-based decisions and implement targeted interventions.
Types of Thematic Maps
Depending on the nature of the data and the specific story a cartographer wishes to tell, different types of thematic maps can be employed. Each style possesses unique visual strengths tailored to specific datasets.
Choropleth Maps
Perhaps the most common type of thematic map, choropleth maps use progressive color shading or patterns within predefined administrative boundaries—such as counties, states, or countries—to represent different values. Typically, darker shades indicate higher concentrations or densities, while lighter shades represent lower values. Choropleth maps are highly effective for displaying categorical or standardized data, such as literacy rates, tax brackets, or average household income across different regions.
Isoline and Isarithmic Maps
Isoline maps connect points of equal value with continuous lines to represent smooth, continuous phenomena. Commonly seen in weather forecasts to show temperature contours (isotherms) or atmospheric pressure (isobars), these maps are also used in topography to depict elevation (contour lines). Isoline maps are ideal for data that transitions gradually across space rather than stopping abruptly at political or administrative borders.
Dot Distribution Maps
Also known as dot density maps, these visualizations use individual dots to represent the presence or quantity of a specific phenomenon. Each dot can represent a single occurrence (one-to-one) or a specified number of occurrences (one-to-many), such as one dot representing one thousand residents. Dot distribution maps are highly intuitive, allowing viewers to quickly identify areas of intense clustering, sparse distribution, or uniform dispersion.
Proportional and Graduated Symbol Maps
These maps scale the size of a chosen symbol—most commonly a circle—in direct proportion to the intensity of the data at a specific geographic point. Unlike choropleth maps, which shade entire regions, proportional symbol maps pinpoint exact locations, making them excellent for visualizing data associated with specific cities, ports, or monitoring stations, such as total cargo volume handled or the magnitude of seismic activity.
Cartograms
Among the most visually striking thematic maps, cartograms intentionally distort geographic space to reflect a specific variable. For example, a cartogram of the world might scale the physical size of countries based on their total population or gross domestic product (GDP) rather than their actual landmass. While they can be disorienting, cartograms are incredibly powerful for challenging geographical preconceptions and emphasizing global imbalances.
Key Elements of a Thematic Map
Creating an effective thematic map is both a science and an art, requiring careful attention to structural design. To ensure that the map is accurate, legible, and objective, cartographers rely on several fundamental elements:
- The Title and Sub A clear, descriptive title is essential to immediately inform the viewer of the map’s subject matter, geographic scope, and the time period of the data being represented.
- The Map Legend: Often referred to as the key, the legend is the decoder ring of a thematic map. It defines what the colors, symbols, shading patterns, or dot sizes represent, ensuring the viewer can accurately interpret the data values.
- The Base Map: This is the underlying reference layer—showing basic features like coastlines, country borders, or major highways—that provides essential geographic context without distracting from the primary thematic data.
- Scale and Orientation: While less prominent than on reference maps, a scale bar and north arrow help orient the viewer and maintain a sense of physical proportion.
- Data Source and Metadata: Transparency is vital in cartography. Credible thematic maps always cite the sources of their data, allowing users to verify the information and understand the methodology behind the visualization.
Applications of Thematic Maps
The versatility of thematic mapping makes it a vital tool across an array of professional sectors and academic disciplines.
In public health and epidemiology, thematic maps are used to track the spread of infectious diseases, identify environmental health hazards, and allocate medical resources during crises. This application dates back to the mid-19th century when Dr. John Snow famously mapped cholera cases in London to trace the source of the outbreak to a contaminated public water pump.
In environmental science and conservation, researchers rely on thematic maps to monitor deforestation rates, track wildlife migration patterns, visualize temperature anomalies, and model the potential impacts of rising sea levels on coastal communities.
For urban planning and public administration, city governments utilize these maps to analyze demographic shifts, optimize public transportation routes, plan utility infrastructure, and identify neighborhoods that lack access to essential services like fresh food or public parks.
In the business and marketing sectors, corporations leverage thematic maps for market research, site selection, and consumer profiling. By mapping regional purchasing habits, income distributions, and competitor locations, businesses can make highly informed decisions regarding where to open new branches or focus their advertising campaigns.
Advantages of Thematic Maps
The widespread adoption of thematic maps stems from several distinct advantages they offer over traditional data presentation formats:
- Immediate Cognitive Impact: Humans are inherently visual creatures. A thematic map allows viewers to grasp complex spatial relationships and regional disparities in seconds, whereas analyzing the same data in a spreadsheet could take hours.
- Enhanced Pattern Recognition: By displaying data geographically, these maps expose spatial anomalies, clusters, and gradients that are virtually impossible to detect in non-spatial formats.
- Effective Communication: Thematic maps serve as universal communication tools, bridging the gap between technical researchers and the general public or political decision-makers.
- Facilitation of Spatial Analysis: They allow analysts to overlay multiple layers of different thematic data to explore potential cause-and-effect relationships, such as mapping crime rates against street lighting density.
Limitations of Thematic Maps
Despite their immense utility, thematic maps are not without their pitfalls. Users and creators must remain aware of several inherent limitations to avoid misinterpretation:
- The Modifiable Areal Unit Problem (MAUP): This statistical phenomenon occurs when data is aggregated into artificial boundaries (such as zip codes or electoral districts). Changing the boundaries can dramatically alter the visual patterns displayed on the map, potentially leading to incorrect conclusions or political manipulation, such as gerrymandering.
- Oversimplification of Complex Realities: To make a map readable, cartographers must simplify and categorize data. This can create a false impression of uniformity within a region, masking internal diversity or sharp localized contrasts.
- Data Quality Dependency: A thematic map is only as accurate as the underlying data used to create it. Inaccurate, outdated, or biased source data will inevitably result in a misleading map.
- Visual Bias and Manipulation: Choice of color schemes, class intervals, and map projections can heavily influence how a map is perceived. A poorly designed map—or one designed with malicious intent—can easily distort the truth to support a specific agenda.
Tools and Software for Creating Thematic Maps
The democratization of technology has made the creation of thematic maps highly accessible. Today, a wide range of powerful software options exist to accommodate different skill levels and project requirements:
- Geographic Information Systems (GIS): Professional-grade software suites like Esri’s ArcGIS and the open-source platform QGIS offer unparalleled capabilities for spatial analysis, data manipulation, and high-quality thematic map production.
- Data Visualization Platforms: Business intelligence tools such as Tableau and Microsoft Power BI feature robust, user-friendly mapping modules that allow users to quickly turn corporate databases into interactive thematic dashboards.
- Web Mapping and Programming Libraries: For developers and web designers, libraries like Leaflet, Mapbox, and D3.js enable the creation of highly customized, interactive, and responsive thematic maps directly for web browsers.
FAQs: What is a Thematic Map?
What is the difference between a thematic map and a reference map?
A reference map is designed to show the locations of geographic features, such as roads, rivers, cities, and political boundaries, primarily to aid navigation. A thematic map, on the other hand, focuses on a specific theme or subject, using geographic boundaries merely as a canvas to visualize statistical data patterns like population density or average temperature.
Can thematic maps be used for historical data?
Yes, thematic maps are highly effective for visualizing historical trends. They can illustrate changes over time, such as shifts in national borders, the migration of populations, the spread of historical pandemics, or the changing industrial output of nations over decades.
What software is best for beginners to create thematic maps?
For beginners, user-friendly data visualization platforms like Tableau or web-based tools like Mapbox and Carto are excellent starting points. For those interested in learning traditional GIS, QGIS is a free, open-source platform with a vast global community and extensive learning tutorials.
How do I choose the right type of thematic map for my data?
The choice depends on the nature of your data. If you are working with continuous data that changes gradually across space (like temperature), isoline maps are ideal. If you are dealing with standardized data tied to administrative boundaries (like unemployment rates by state), a choropleth map is best. For point-specific magnitudes, proportional symbol maps are highly recommended.
Are thematic maps only used in geography?
No, thematic maps are widely utilized across a vast spectrum of fields outside of traditional geography, including economics, sociology, public health, marketing, political science, meteorology, and urban planning. Any discipline that deals with data containing a spatial or geographic component can benefit from thematic mapping.