In a rapidly changing world driven by information, the ability to make sense of numbers is no longer a skill reserved for the corporate boardroom or the scientific laboratory. For more than fifteen thousand elementary school students spread across nineteen United States states and eight countries, data literacy has become an engaging, hands-on adventure, thanks to a burgeoning educational initiative that is redefining how young learners interact with information.
In under two years, the team behind the initiative has helped thousands of children build foundational confidence in collecting, visualizing, and interpreting data. Operating on the belief that critical thinking and clear communication are vital competencies that do not need to wait until adulthood, the movement centers on helping people make sense of information and present it effectively. This philosophy forms the heartbeat of storytelling with data, an organization that has successfully channeled its core mission toward younger audiences through its vibrant educational offshoot, Daphne Draws Data.
As the Education and Outreach Specialist for the organization, the past twenty-four months have marked a remarkable period of growth, community building, and expanding horizons. Reflecting on this milestone offers a meaningful opportunity to examine what has been accomplished since the initial publication of the project, while looking ahead to the collaborative efforts required to reach the next cohort of 15,000 children.
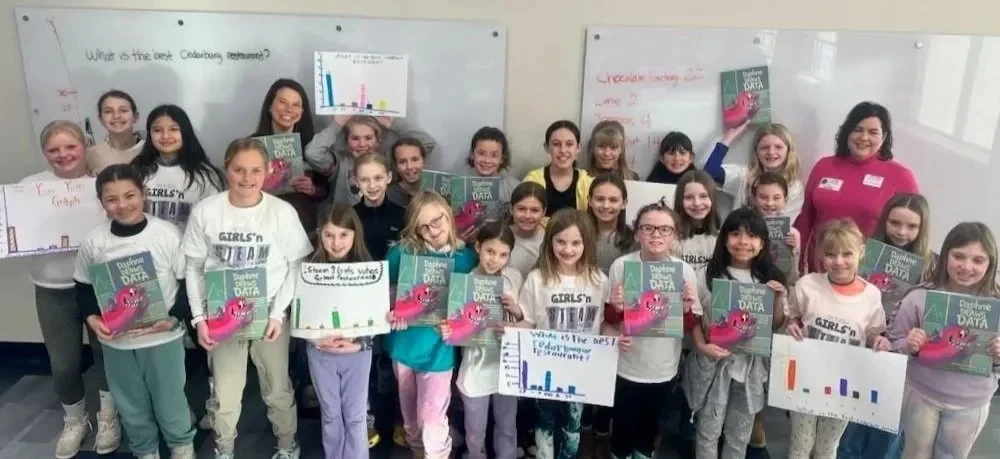
At the core of this global outreach is a deeply collaborative approach. By forging partnerships with a diverse array of community anchors—including nonprofits, after-school organizations, local libraries, museums, and specialized STEM-focused education groups—the initiative has been able to design and deliver hands-on graphing experiences. These interactive sessions are meticulously crafted to guide children through the complete analytical cycle: collecting their own data, physically drawing graphs, and interpreting what their discoveries actually reveal about the world around them.
Recognizing that meaningful learning must extend far beyond the confines of a single workshop or program, the initiative has made significant investments in educational literature. To support continued learning in underserved communities and Title I schools, nearly 9,000 books have been donated directly to classrooms and children who might otherwise lack access to such resources. Schools, community leaders, and educators interested in learning more about these programs or inquiring about book donations are encouraged to reach out directly via email.
Significantly, the ripple effects of these data literacy programs have extended well beyond the elementary school demographic, creating unexpected professional and personal development opportunities for the adults in these children’s lives. One of the most rewarding and unforeseen outcomes of the initiative has been its capacity to educate teachers, nonprofit leaders, program coordinators, and parents. These adults are learning the exact same core data storytelling lessons traditionally taught to seasoned business professionals: how to choose an appropriate graph, how to ruthlessly remove clutter from a visual presentation, how to effectively focus an audience’s attention, and how to communicate a compelling narrative through numbers.
For nonprofit leaders and educators operating in resource-constrained environments, mastering these communication techniques carries immense practical value. The newly acquired data storytelling skills equip them to more persuasively advocate for critical funding, secure essential resources, and clearly demonstrate the tangible impact of their community work to stakeholders and donors alike.
Building upon the momentum of books and localized graphing programs, this year marked a major technological and experiential expansion with the launch of the interactive Daphne Draws Data exhibit. Designed to immerse children in a dynamic environment, the exhibit invites young visitors to contribute their own data in real time, compare their unique responses directly with those of their peers, and witness firsthand how individual data points coalesce to become part of a larger, collective story. Currently housed at the Kansas Children’s Discovery Center, the exhibit has captured the imagination of young visitors, with organizers harboring active ambitions to expand the installation to additional museums and science centers across the country.
Another major driver behind the initiative’s expanding reach has been the dedication of enthusiastic volunteer leaders known as Data Detectives. These passionate community champions take the foundational "graphing with Daphne" programs and bring them directly to their local neighborhoods and schools. Equipped with pre-developed program resources provided by the organization, these volunteers empower children to answer their own curious questions through active data collection and visual creation.
As the initiative looks toward the future, the overarching mission remains focused on helping children build lifelong confidence with data—equipping them with analytical tools that will serve them well throughout their educational and professional journeys.