In the rapidly evolving landscape of generative artificial intelligence, developers and system architects frequently look to raw token throughput as the primary benchmark for large language model application performance. However, industry experts are increasingly pointing out that a high token throughput does not necessarily translate to a fast, responsive user experience. While a system might process massive volumes of text under ideal laboratory conditions, individual users interacting with chat applications or automated workflows often encounter frustrating delays. The initial response may take an uncomfortably long time to appear, or subsequent tokens may stream sluggishly, particularly when servers experience concurrent load. Throughput alone simply cannot capture these critical nuances.
To bridge this diagnostic gap, performance engineers rely on a comprehensive suite of large language model inference metrics. These analytical tools break down system performance into precise, measurable components—ranging from initial response delays and token generation speeds to overall system load and infrastructure limits. By understanding these metrics, development teams can accurately evaluate latency, pinpoint hidden infrastructure bottlenecks, and track system performance regressions over time.
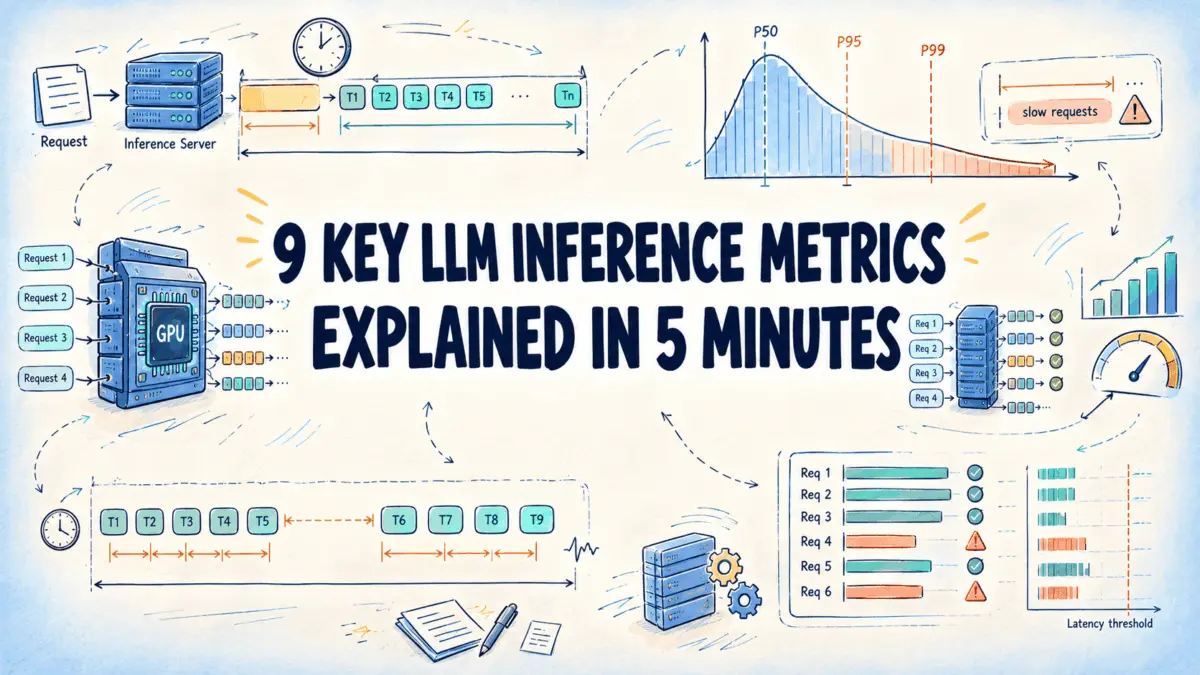
Understanding how these metrics operate begins with analyzing the timeline of a single request. The lifecycle of any inference request is defined by four core temporal values. The process initiates when a request leaves the client infrastructure, followed by the arrival time of the first generated output token, and concludes with the arrival time of the final token in the sequence. Furthermore, analyzing streaming stability requires tracking the exact arrival timestamp of every individual output token as it streams back to the user.
When mapped onto a chronological timeline, these timestamps effectively divide a single request into distinct operational segments. Before the arrival of the first token, the request typically sits waiting in a server queue before the underlying hardware executes the prefill phase. During this crucial initial phase, the model processes the incoming prompt and generates the very first output token. Once that initial token is secured, the server transitions into the decoding phase, emitting subsequent tokens sequentially, usually one step at a time. Every standard latency metric is specifically designed to measure either one of these isolated segments or the entire end-to-end span of the interaction.
The first major category of performance indicators focuses on measuring latency, detailing precisely how long a user is forced to wait during a single request and how those delays accumulate across millions of interactions. Among these, the time to first token stands out as one of the most critical measurements for interactive applications. This metric captures the total delay between a client sending a request and receiving that initial output token. Because it encompasses network travel time, server queue delays, and the intensive prompt-processing step, the time to first token naturally grows as server load and prompt lengths increase. Interactive chat applications monitor this specific figure with intense scrutiny because it dictates exactly how long a user must stare at a blank screen before receiving any acknowledgment from the system.
Beyond the initial response, engineers must evaluate end-to-end latency, which measures the complete duration of the user wait time from the initial request transmission to the arrival of the final token. This metric represents the cumulative sum of the initial first-token wait and the subsequent streaming duration. While end-to-end latency provides a comprehensive view of the entire interaction, isolating the token generation time reveals how long the server takes to deliver every token that follows the initial response. Because token generation time naturally expands when a response requires a larger number of output tokens, engineers rely on auxiliary metrics to properly evaluate the true speed of the text stream.
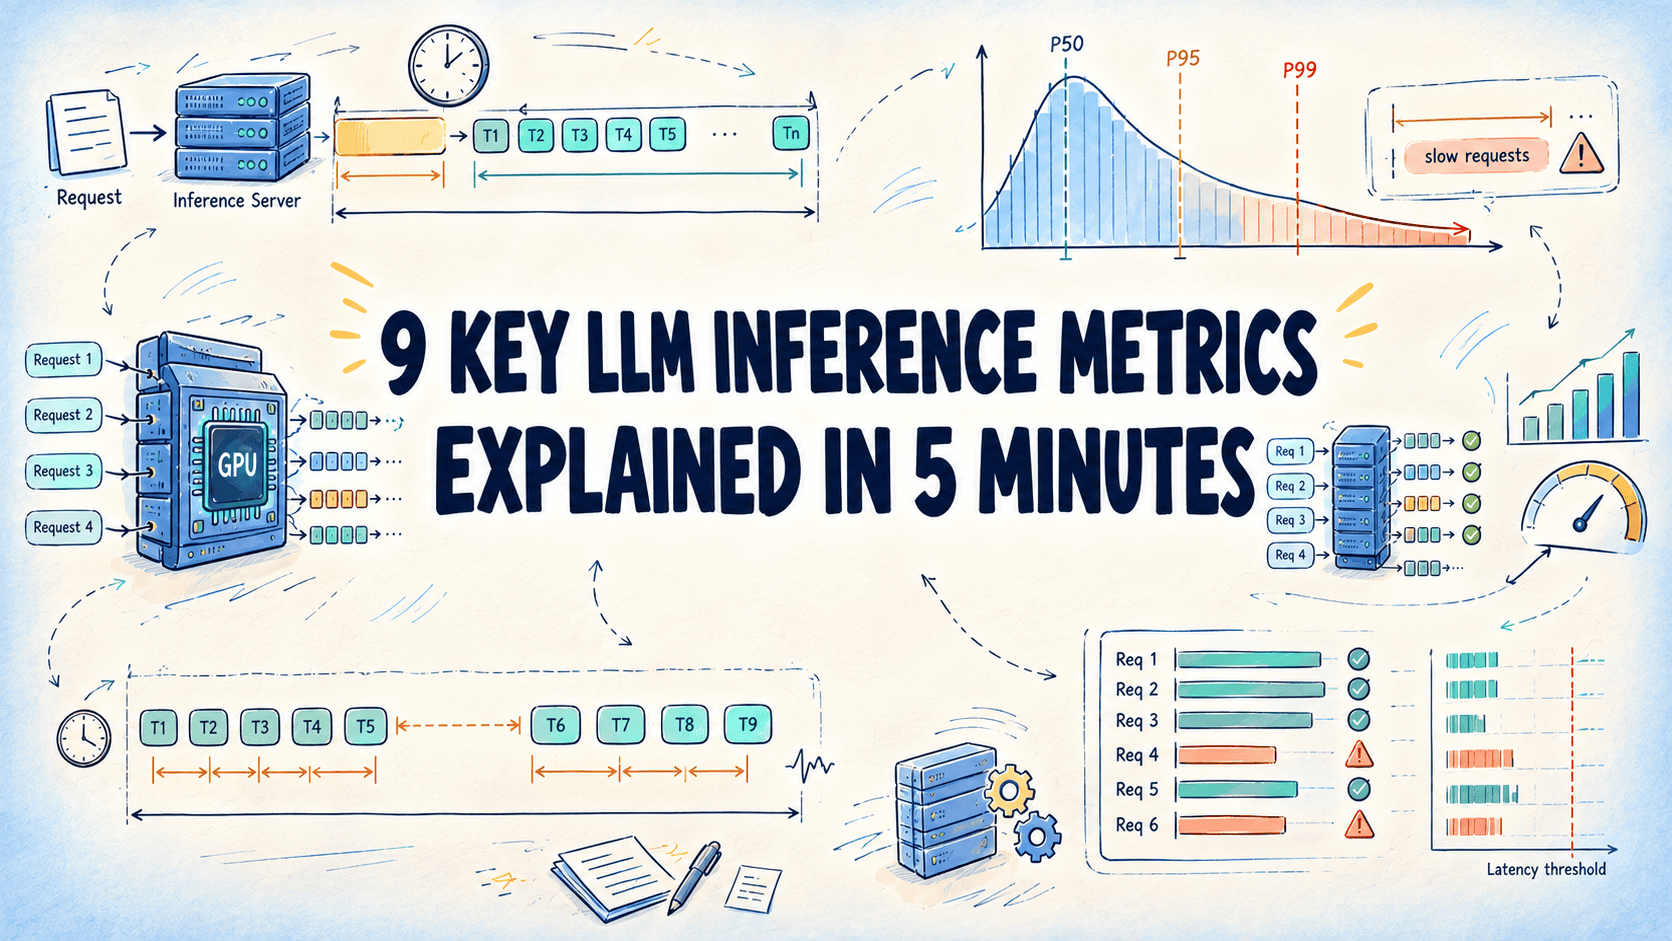
To normalize streaming velocity, performance teams utilize the time per output token, which calculates the average duration between consecutive output tokens after the initial response has been delivered. By spreading the total token generation time evenly across the subsequent tokens, this metric offers a clear view of streaming fluidity. Because the very first token is already accounted for in the initial delay metric, the mathematical calculation excludes it from the denominator, making the metric undefined for single-token replies. Furthermore, benchmarking tools often employ alternative interpretations or overlapping terms, such as inter-token latency, making it vital for engineering teams to confirm exact calculation definitions before comparing results across different platforms.
Inter-token latency specifically measures the microscopic temporal gap between two consecutive output tokens. While a single request containing numerous output tokens will yield multiple individual gaps, tracking these intervals allows engineers to detect momentary freezes or stutters in the text stream. When evaluating massive volumes of traffic across numerous requests, different averaging methods can yield distinct analytical insights. Some computational approaches weigh long requests more heavily, while others ensure that both brief and extended interactions receive equal representation. Tracking individual gaps remains essential because sudden spikes in inter-token latency reveal the precise moments when a generation stream stalls.
Because latency naturally fluctuates from one request to another, viewing a single data point per request is insufficient for large-scale deployments. Instead, system administrators analyze performance as a distribution across numerous requests, utilizing statistical measures such as the mean, median, and tail percentiles. While averages provide a general baseline, tail percentiles—such as the ninety-ninth percentile—expose the worst-case scenarios experienced by users during peak operational windows. Industry best practices dictate that these percentiles must be computed from raw, combined samples across all serving nodes, as averaging pre-computed per-server percentiles fails to accurately reflect the true tail latency of combined network traffic.
While latency metrics evaluate individual user wait times, assessing the infrastructure as a whole requires a separate class of measurements focused on throughput and goodput across a defined operational window. Requests per second measures the volume of requests a server successfully completes per unit of wall-clock time. However, because this metric completely ignores the variable computational work carried out by different prompts, it is only useful when comparing test runs that utilize identical distributions of prompt and output lengths.
To account for the volume of data being processed, engineers track tokens per second, which quantifies the volume of tokens a server processes across all active requests within a given timeframe. This metric is further divided into input and output forms, reflecting prompt processing and token generation respectively. Workloads characterized by exceptionally lengthy prompts and brief replies can generate high input throughput figures while producing minimal output text, underscoring the importance of clearly defining which form is being evaluated in any performance report.
The ultimate measure of production readiness, however, is goodput. This advanced metric calculates the rate of successfully completed requests that strictly adhere to predefined service-level objectives. Service-level objectives establish rigid latency ceilings for initial response times, token generation speeds, and overall end-to-end duration. A request is only classified as successful if it satisfies every single latency constraint simultaneously. By dividing the count of fully compliant requests by the total measurement window, infrastructure teams derive a realistic picture of usable system capacity. Goodput can never exceed overall request throughput, and the mathematical gap between the two figures highlights the precise volume of user traffic failing to meet operational quality standards.
Ultimately, evaluating large language model inference performance requires looking far beyond simplistic throughput claims. By dissecting individual requests into initial waiting periods and continuous streaming phases, and by rigorously tracking both statistical latency distributions and strict service-level compliance, engineering teams can build robust, highly responsive artificial intelligence applications capable of delivering a consistently smooth experience under heavy real-world production loads.