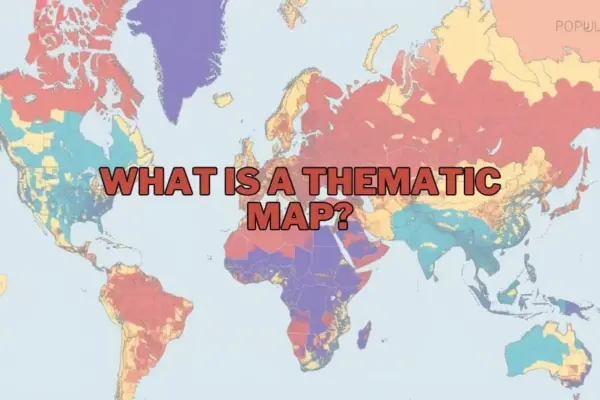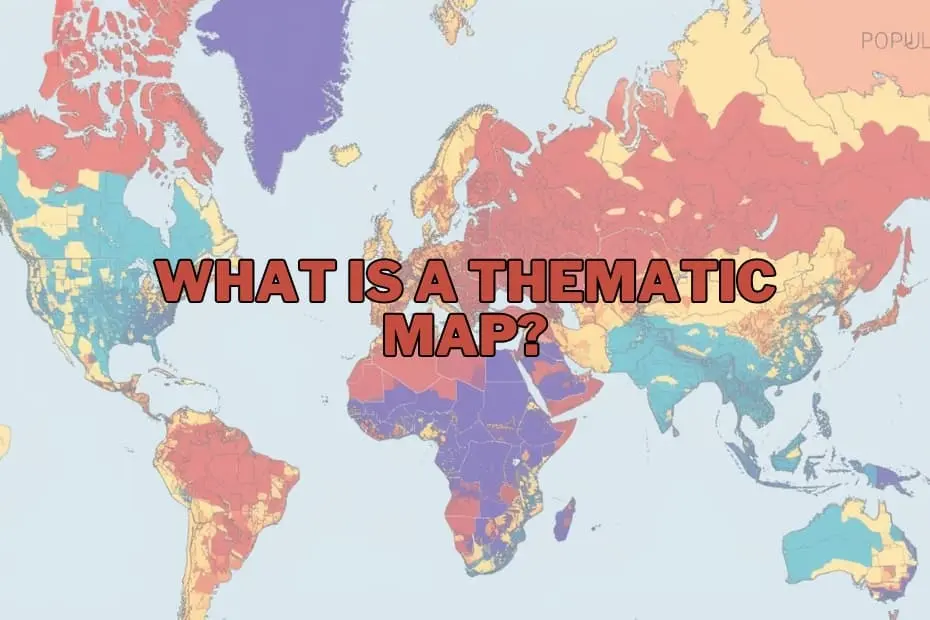
In the modern landscape of data visualization and geographic information science, maps have evolved far beyond their traditional role as simple tools for navigation. Today, they serve as sophisticated instruments for narrative storytelling, pattern recognition, and the decoding of highly complex spatial datasets. Among the diverse array of cartographic techniques available to researchers, thematic maps represent a uniquely powerful methodology for visualizing quantitative and qualitative data in a geographically meaningful way.
Unlike standard reference maps that prioritize physical infrastructure and terrain, thematic maps focus on the spatial distribution of a specific subject or theme. By translating abstract statistics into visual patterns across a geographic landscape, these maps allow policymakers, scientists, and researchers to uncover hidden trends, analyze socioeconomic disparities, and make highly informed decisions. Understanding the structural design, diverse classifications, and practical applications of thematic maps is essential for anyone looking to navigate the complexities of modern spatial data analysis.
Understanding the Thematic Map
At its core, a thematic map is a specialized cartographic tool designed to illustrate the geographic distribution of a specific theme, subject, or phenomenon. While reference maps—such as street maps, topographic maps, or atlas pages—are designed to show the precise location of physical features like highways, rivers, cities, and political boundaries, thematic maps use these geographic features merely as a structural baseline. The primary focus of a thematic map is to display spatial variations in data related to a single topic, such as population density, annual rainfall, average household income, or public health metrics.
By utilizing visual variables such as color gradients, proportional symbols, textures, and shading, thematic maps simplify highly complex datasets. For instance, rather than presenting a researcher with a massive spreadsheet containing thousands of regional unemployment figures, a thematic map can instantly highlight economic distress zones by using varying shades of red or blue across a regional boundary. This visual transformation allows the human brain to process vast amounts of geographic information rapidly, identifying outliers, clusters, and gradients that would otherwise remain hidden in raw numerical data.
Purpose and Importance of Thematic Maps
The fundamental purpose of a thematic map is to communicate complex spatial relationships clearly and efficiently. In an era defined by data overload, these maps act as a cognitive bridge, translating raw numbers into actionable geographic intelligence. By mapping specific themes, researchers can explore how different phenomena interact with geographic space, allowing them to formulate hypotheses, track environmental changes, and model future scenarios.
The importance of thematic mapping is particularly evident in its ability to reveal correlation and causation. For example, overlaying a thematic map of air pollution levels with another depicting pediatric asthma rates can visually demonstrate environmental health disparities. In urban planning, mapping population growth alongside public transit access helps municipal authorities identify underserved communities. Whether used by environmental scientists monitoring the degradation of forest cover, epidemiologists tracking the spread of infectious diseases, or corporate analysts identifying new demographic markets, thematic maps provide the spatial context necessary to turn raw data into strategic solutions.
The Primary Types of Thematic Maps
To effectively represent different types of data, cartographers have developed several distinct styles of thematic maps. Choosing the correct map type is critical, as the visual structure must align with the nature of the data being represented—whether it is continuous, discrete, qualitative, or quantitative.
Choropleth Maps
Choropleth maps are among the most widely used thematic maps. They represent data by coloring or shading predefined geographic areas, such as countries, states, or census tracts, based on a specific statistic. The intensity of the color typically corresponds to the value of the data; for example, darker shades might represent higher population densities, while lighter shades represent lower densities. Choropleth maps are highly effective for displaying standardized data, such as percentages, rates, or densities, across established political or administrative boundaries.
Dot Distribution Maps
Dot distribution (or dot density) maps use individual dots to represent the presence, quantity, or occurrence of a specific phenomenon across a geographic area. In a one-to-one dot map, each dot represents a single occurrence of an event, such as a localized crime or a reported case of a disease. In a one-to-many dot map, a single dot represents a specific quantity of a phenomenon, such as 1,000 acres of agricultural land. These maps are exceptional for showing spatial density and identifying clusters without being constrained by administrative boundaries.
Proportional and Graduated Symbol Maps
Proportional symbol maps scale the size of a specific symbol—most commonly a circle—in direct proportion to the data value at a given location. Unlike choropleth maps, which apply color to entire geographic areas, proportional symbol maps place symbols at specific points or within defined regions. For example, a map visualizing oil production might feature larger circles over major oil-producing cities and smaller circles over minor ones. This approach allows cartographers to represent absolute quantities while preserving the underlying geography.
Isarithmic (Isoline) Maps
Isarithmic maps, commonly referred to as isoline maps, use continuous lines to connect points of equal value across a geographic surface. These maps are ideal for visualizing continuous phenomena that do not conform to political borders, such as temperature (isotherms), atmospheric pressure (isobars), or elevation (contour lines). By creating smooth gradients, isoline maps provide a highly accurate representation of natural and environmental trends across large regions.
Cartograms
A cartogram is a unique type of thematic map in which geographic space is intentionally distorted or scaled to reflect a specific variable. Instead of maintaining true physical size and shape, areas on a cartogram expand or contract based on their data value. For example, a global cartogram scaled by population would depict India and China as massive landmasses, while geographically large but sparsely populated nations like Canada and Australia would shrink significantly. Cartograms are highly impactful visual tools that challenge traditional geographic perceptions to emphasize socioeconomic realities.
Key Elements of a Thematic Map
Designing a legible and accurate thematic map requires careful integration of several fundamental cartographic elements. Without these components, a map risks confusing the viewer or misrepresenting the underlying data.
- The A clear, concise title is essential to immediately inform the viewer of the map’s subject, geographic scope, and the time period of the data being represented.
- The Legend: The legend is the key to decoding the map. It explains the meaning of the colors, symbols, shading, and dot values used, ensuring that the visual representation can be accurately translated back into numerical or categorical data.
- Map Body and Base Map: The map body contains the thematic data layers superimposed over a simplified base map. The base map provides necessary geographic reference points, such as coastlines or political boundaries, without distracting from the primary theme.
- Scale and Orientation: Even though thematic maps focus on data distributions rather than navigation, indicating scale and direction (such as a north arrow) remains important for maintaining spatial context.
- Data Source and Metadata: Credibility is paramount in spatial analysis. Including the source of the data and the year it was collected ensures transparency and allows viewers to verify the reliability of the information.
Applications of Thematic Maps Across Industries
The versatility of thematic mapping makes it an indispensable asset across a wide range of academic, public, and private sectors. By contextualizing data geographically, diverse industries can address complex challenges with greater precision.
Public Health and Epidemiology
In public health, thematic mapping is a vital tool for tracking disease outbreaks, analyzing access to healthcare facilities, and identifying environmental health hazards. Historically, mapping disease clusters has helped epidemiologists locate the sources of contamination; today, modern thematic maps are used to track global pandemics, allocate vaccine resources, and identify areas with high rates of chronic illnesses.
Urban Planning and Demographics
Urban planners and municipal governments rely heavily on thematic maps to guide infrastructure development, zoning laws, and public transit routing. By mapping population growth, housing density, and traffic patterns, planners can design more resilient and efficient cities. Demographic mapping also helps local governments identify underserved neighborhoods that require investments in parks, schools, or emergency services.
Environmental Science and Resource Management
Environmental scientists use thematic maps to monitor the impacts of climate change, track deforestation, map wildlife habitats, and manage natural resources. Isoline maps depicting temperature anomalies or rainfall patterns help researchers understand broader climate trends, while choropleth maps can illustrate soil erosion risks or water scarcity levels across agricultural zones.
Business Intelligence and Market Research
In the private sector, businesses leverage thematic mapping for site selection, target marketing, and supply chain optimization. By visualizing demographic data, purchasing power, and competitor locations, companies can identify high-potential markets for expansion and customize their localized advertising campaigns.
Advantages and Limitations of Thematic Mapping
While thematic maps are incredibly powerful communication tools, they possess inherent strengths and weaknesses that cartographers and data analysts must carefully navigate.
Advantages
The primary advantage of thematic maps is their ability to simplify complex, high-volume datasets into intuitive visual narratives. They allow viewers to instantly grasp regional patterns, identify spatial anomalies, and understand geographic relationships that would be difficult to discern from tables or text. Furthermore, they democratize data, making scientific and statistical findings highly accessible to general audiences, stakeholders, and policymakers.
Limitations
Despite their utility, thematic maps can inadvertently mislead viewers if designed poorly or interpreted incorrectly. One major limitation is the Modifiable Areal Unit Problem (MAUP), where aggregating data into different administrative boundaries (such as zip codes versus counties) can drastically alter the visual patterns displayed on the map.
Additionally, choropleth maps can create a visual bias known as the area-size anomaly, where large geographic areas dominate the map visually, giving the false impression that the data value of that large area is more significant than that of a smaller, highly populated urban center. Cartographers must also carefully choose their data classification methods, as altering classification intervals can dramatically change how patterns are perceived.
Modern Tools and Software for Creating Thematic Maps
The democratization of geographic technology has made the creation of professional thematic maps highly accessible. Today, a variety of software options cater to different skill levels, from beginners to advanced spatial data scientists.
For professional geographers and spatial analysts, Geographic Information Systems (GIS) software remains the industry standard. Platforms like Esri ArcGIS offer highly sophisticated spatial analysis tools, extensive geoprocessing capabilities, and advanced cartographic design options. For those seeking a powerful, open-source alternative, QGIS provides a robust, community-driven platform with an extensive library of plugins for thematic map creation.
For beginners, business analysts, and journalists, data visualization platforms such as Tableau and Microsoft Power BI offer intuitive, drag-and-drop interfaces that allow users to generate clean, interactive thematic maps directly from spreadsheets. Additionally, web-based mapping platforms like Carto and Mapbox enable users to design and publish highly interactive, cloud-based spatial visualizations for websites and digital applications, bridging the gap between complex spatial databases and public-facing media.
FAQs: What is a Thematic Map?
What is the difference between a thematic map and a reference map?
A thematic map is designed to display data related to a specific subject or theme, such as average income or temperature gradients, focusing on spatial patterns. In contrast, a reference map focuses on displaying general geographic features, such as roads, rivers, political boundaries, and landforms, primarily for locational reference and navigation.
Can thematic maps be used for historical data?
Yes, thematic maps are highly effective for visualizing historical trends and changes over time. Researchers frequently use them to illustrate historical population shifts, changing political borders, agricultural transitions, or the geographic spread of historical events like wars and industrialization.
What software is best for beginners to create thematic maps?
For beginners, user-friendly data visualization tools like Tableau or cloud-based mapping platforms like Carto are highly recommended. For those looking to explore dedicated GIS software without a steep learning curve or high licensing costs, QGIS is an excellent, free, open-source starting point with extensive online tutorials.
How do I choose the right type of thematic map for my data?
The choice depends entirely on the nature of your data. If you are representing continuous, naturally occurring data (such as temperature or elevation), an isoline map is appropriate. If you are visualizing standardized statistical data across administrative borders (such as literacy rates by country), a choropleth map is ideal. For absolute quantities or point-specific data, proportional symbol or dot distribution maps are usually the best choice.
Are thematic maps only used in geography?
No, thematic maps are widely utilized across a vast array of disciplines outside of traditional geography. They are essential tools in epidemiology and public health, economics, market research, sociology, political science, urban planning, environmental studies, and journalism, among other fields.