In corporate environments, flagging an anticipated staffing shortfall is a critical responsibility that immediately commands executive attention. However, presenting a high-level forecast alone rarely provides leadership with the nuanced context required to make informed operational decisions. A forecast identifies the destination, but it rarely reveals the underlying terrain or the origin of the gap. When organizations face multifaceted workforce challenges, analysts often fall into the trap of attempting to cram every granular detail, metric, and historical comparison into a single, dense visualization.
This exact challenge took center stage during a recent custom client workshop hosted by Storytelling with Data. The participating team faced a classic corporate communications hurdle: they needed to demonstrate to executive leadership that full-time equivalent (FTE) staffing levels were projected to fall significantly below the established operational plan. Furthermore, they needed to communicate that a distinct decline in operations support roles was a primary driver behind the shortfall. Ultimately, the ultimate objective of the presentation was to prompt leadership to engage in a strategic discussion regarding how to address and resolve the emerging gap.

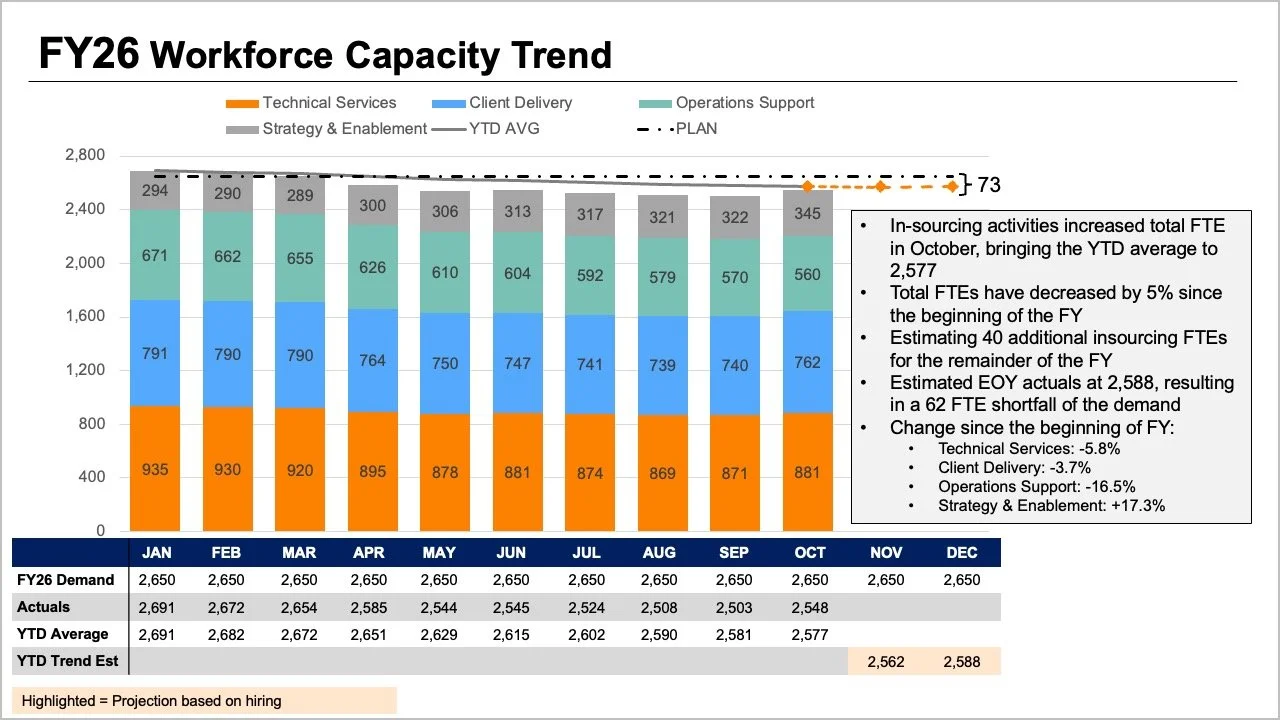
While all the essential information was technically present in the team’s initial reporting materials, the core narrative was effectively buried beneath layers of visual complexity. The original slide demanded that readers process multiple variables simultaneously. The tops of stacked bar charts, overlapping trend lines, and dense data tables attempted to display overall FTE metrics in several competing ways. Simultaneously, internal segments within the bars attempted to illustrate role-level breakdowns, while additional layers of interpretation were piled on through plan figures, actual counts, year-to-date averages, and forward-looking projections.
Every individual element served a logical purpose and answered a reasonable business question. Yet, when crammed together into a single graphic, these competing components created cognitive overload, making it exceedingly difficult for leaders to extract clear answers to any single question. Stepping back to evaluate what executives actually required for the upcoming strategic discussion provided a clearer path forward. Leaders needed definitive answers to two core inquiries: How significant of a staffing shortfall should the organization realistically anticipate, and what do the most recent staffing metrics reveal about where specific structural shifts have occurred?
Rather than attempting to force every data point and variable into a single, overcrowded graph, the team decided to decouple the information, dividing the narrative into two distinct, focused visuals, with each graphic dedicated to answering a single question.
Utilizing a Line Chart to Clarify the Overall Trend
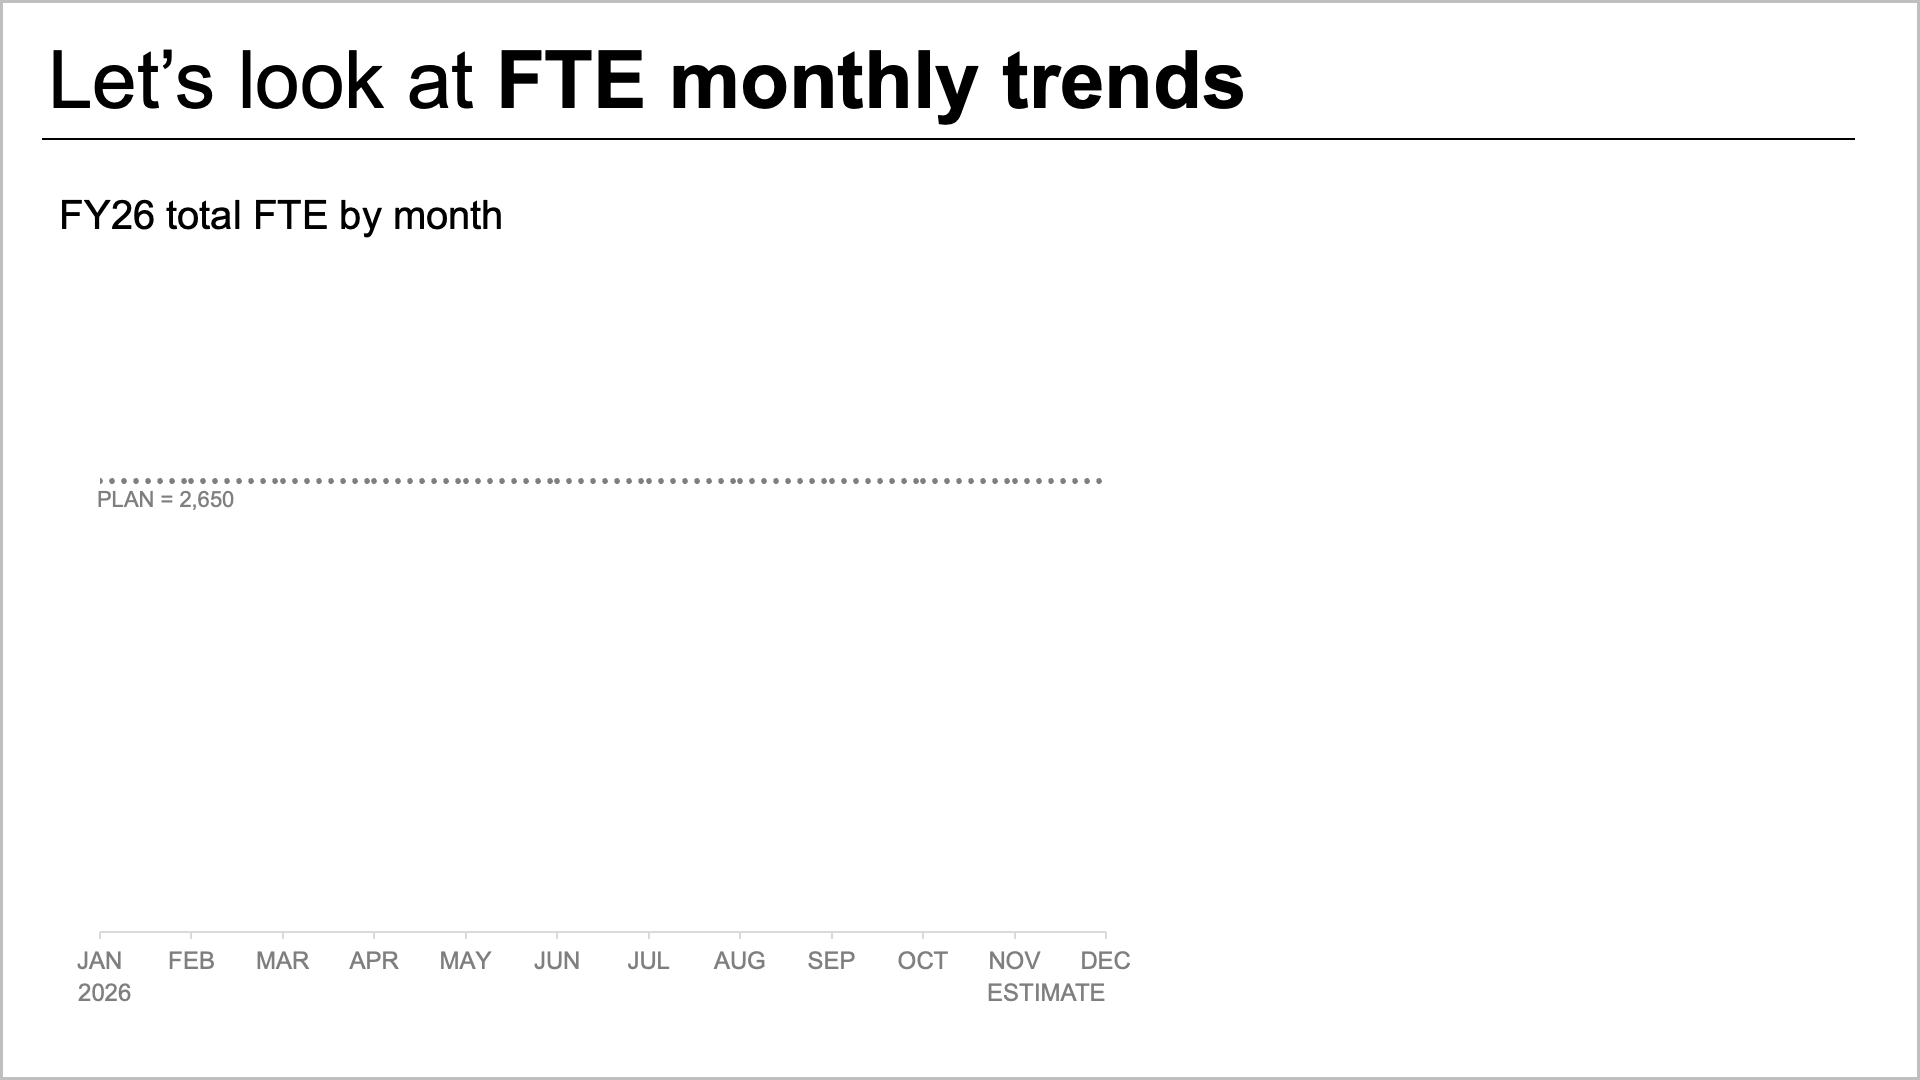
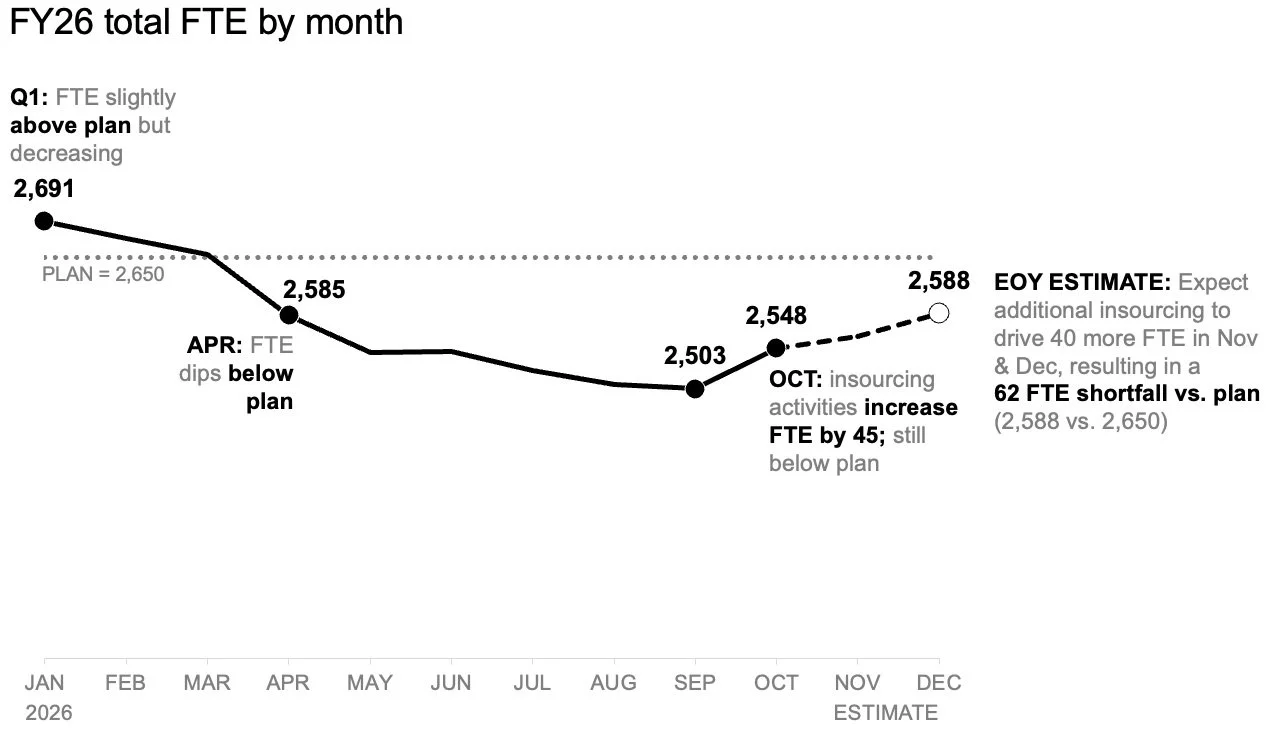
To address the first major leadership concern regarding the anticipated shortfall, the team turned to a standalone line chart. This focused view made it immediately apparent how staffing trajectories had tracked against the original plan established at the beginning of the fiscal year, as well as how future forecasts compared against those baseline targets. By stripping away extraneous details, this streamlined view created ample visual space to incorporate targeted annotations at critical inflection points. Readers were able to home in directly on the expected gap to plan without first needing to decode complex role mixes or scan through convoluted data tables.
Implementing a Second View for Role-Level Breakdowns
Once the overall trend and expected target variance were established, the reporting shifted toward examining role-level changes within the actual data to determine precisely where the largest operational shifts had taken place. In this context, minor month-to-month variations were secondary to the broader structural trajectory. Plotting only the data points from the start of the year and the latest actual reporting month using a slopegraph provided an immediate, uncluttered visualization of which specific roles had shifted the most over time. By applying color and contextual labeling sparingly, the design successfully drew the audience’s attention directly to the notable decline in operations support roles, allowing executives to instantly recognize the primary driver of the variance.
Together, these two visualizations functioned as a cohesive pair. The standalone line chart effectively answered the overarching question of what was happening at a macro level, while the slopegraph clarified which specific roles had experienced the most significant changes during the period in question.
Strategic Planning for Data Distribution and Presentation
When designing corporate communications, the delivery format significantly influences how information must be structured. For static summaries that might be reviewed independently or forwarded across executive channels without a live presenter, both analytical views can be effectively positioned together on a single page or slide. A strong, takeaway-oriented slide title can explicitly state the expected shortfall, while concise supporting text points directly to the decline in operations support roles and signals the necessity for leadership to deliberate on next steps. In this static format, the charts provide robust empirical evidence without competing for visual prominence.
For live presentations, however, the same underlying data can be deployed through a more dynamic sequence. Rather than demanding that an audience absorb an entire summary simultaneously while a speaker talks over the slide, presenters can walk through the overall macro forecast first, gradually reveal the actual role-level changes in a step-by-step manner, and finally pivot the conversation toward strategic next steps. This paced sequence allows the audience to fully absorb one critical insight before transitioning to the next. While the underlying data and core message remain identical, the controlled pacing changes how much information the audience is required to process at any single moment.
Prioritizing Clarity by Giving Each Question Its Own View
When comprehensive organizational reports require deep levels of detail, the temptation to consolidate everything into a single, unified view is understandable. Such an approach often feels efficient to the creator. However, simply packing more information into a single space does not automatically translate to heightened understanding for the consumer.
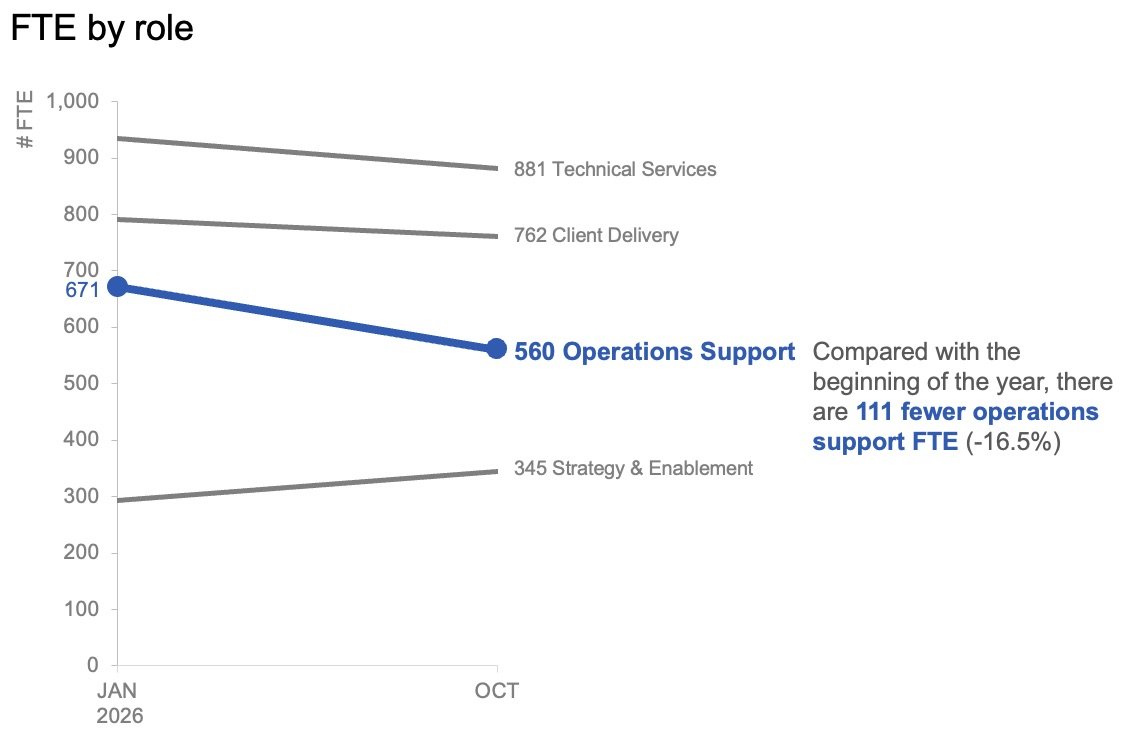
By separating the overarching FTE trend from the granular, role-level changes, both insights became significantly easier to discern. Rather than forcing executives to untangle a web of overlapping data streams, the separated views delivered a clear, focused narrative that provided the precise evidence leadership needed to drive meaningful action.