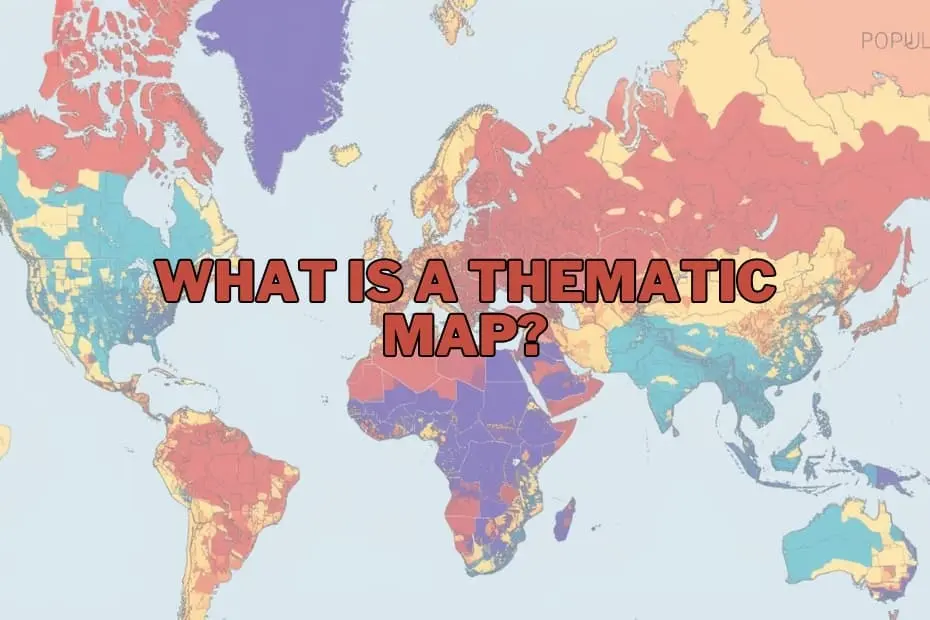
In the rapidly evolving landscape of data visualization and geographic information science, maps have transcended their traditional role as mere navigational aids. Today, they serve as powerful instruments for narrative expression, uncovering hidden spatial patterns, and translating complex datasets into actionable insights. While general reference maps remain essential for guiding travelers from one point to another, a different class of cartography has become indispensable for researchers, policymakers, and business leaders: the thematic map.
Thematic mapping represents a unique intersection of data science and graphic communication. By focusing on specific subjects—ranging from demographic shifts and environmental changes to economic trends—thematic maps allow analysts to visualize the "why" and "where" of global phenomena. Understanding the design, utility, and limitations of these maps is crucial for anyone looking to make sense of a world increasingly defined by spatial data.
Defining the Thematic Map: A Focus on the Subject
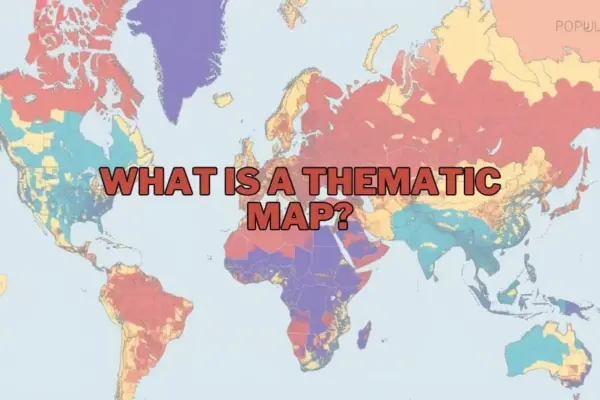
A thematic map is a specialized map designed to visually represent data related to a specific theme or subject across a defined geographic area. Unlike general reference maps, which prioritize the precise location of physical features such as highways, rivers, coastlines, and urban boundaries, thematic maps use these geographic features merely as a background framework. The primary focus is always on the spatial distribution and structural patterns of a chosen variable.
For instance, while a reference map of a state will show its highways, cities, and parks, a thematic map of the same state might display population density, average annual rainfall, or median household income. By utilizing colors, symbols, shading, and other graphic variables, thematic maps simplify dense statistical tables, making it immediately apparent where certain phenomena are concentrated, where they are scarce, and how they transition across space.
This visual translation is vital for geographers, environmental scientists, and urban planners. Raw statistical data, when presented in spreadsheet format, can easily obscure geographical trends. When mapped, however, that same data can instantly reveal a environmental crisis, a public health emergency, or an emerging economic market.
The Strategic Importance of Spatial Context
The ultimate purpose of a thematic map is to communicate complex spatial data quickly and effectively. In an era characterized by information overload, the ability to synthesize thousands of data points into a single, comprehensible graphic is highly valuable. These maps do not just answer the question of where something is; they help answer why it is there and how it relates to its surroundings.
Consider the ongoing global efforts to address climate change. A thematic map showing rising sea surface temperatures alongside coastal population centers can assist disaster response agencies in identifying the communities most vulnerable to severe weather events. Similarly, in the realm of public health, mapping the occurrences of a disease outbreak against local water sources or air quality indexes can help epidemiologists identify potential environmental vectors.
In urban planning and municipal governance, thematic maps are used to guide resource allocation. By visualizing school enrollment rates, traffic congestion patterns, or public transit usage, local governments can make data-driven decisions about where to construct new schools, expand highway lanes, or introduce new bus routes. In the private sector, businesses leverage thematic mapping for market analysis, determining where to open new branches based on localized consumer spending habits and demographic profiles.
A Taxonomy of Spatial Visualizations
Thematic maps are not monolithic; they encompass a variety of styles, each suited to specific types of data and analytical objectives. Choosing the appropriate map type is critical to ensuring that the underlying message is communicated accurately and without distortion.
Choropleth Maps
Perhaps the most common type of thematic map, choropleth maps use progressional color shading or patterns applied to predefined administrative areas—such as counties, states, or nations—to represent the average value of a variable within those boundaries. For example, a choropleth map of the United States might use increasingly dark shades of blue to represent states with higher average household incomes. These maps are highly effective for visualizing standardized data (such as rates, percentages, or densities) but can occasionally mislead viewers if the geographic sizes of the administrative units do not correlate with the data values.
Dot Density Maps
Dot density maps use individual dots to represent a specified quantity of a given phenomenon. Each dot represents a fixed value, such as 100 people, 50 agricultural farms, or 10 reported cases of a disease. The spatial concentration of these dots provides an intuitive visual representation of density and distribution. Where the dots cluster closely together, the phenomenon is highly concentrated; where they are sparse, the phenomenon is rare. This method is particularly useful for showing raw counts and preserving the underlying geography of the data.
Proportional and Graduated Symbol Maps
On a proportional or graduated symbol map, cartographers place symbols—most commonly circles, squares, or bar charts—over specific geographic locations. The size of the symbol varies in direct proportion to the value of the data at that location. For instance, a map showing major global airports might use circles of varying sizes to represent annual passenger volumes. This approach allows viewers to compare absolute quantities across different points quickly, regardless of the physical size of the geographic regions involved.
Isoline and Isarithmic Maps
Isoline maps utilize continuous lines to connect points of equal value, creating a visual gradient of change across a geographic space. The most familiar examples of isoline maps are topographic maps showing elevation contours, but the technique is equally valuable for mapping continuous weather and climate data, such as barometric pressure (isobars) or temperature (isotherms). These maps are ideal for visualizing phenomena that transition smoothly across space rather than stopping abruptly at administrative borders.
Cartograms
A cartogram is a unique and highly stylized thematic map in which geographic areas are intentionally distorted, resized, or reshaped to reflect a specific variable. For example, a cartogram of the world might scale the physical size of countries based on their total population rather than their actual land area. In such a map, countries with massive populations like India and China appear vastly enlarged, while geographically large but sparsely populated nations like Canada or Russia shrink significantly. Cartograms are powerful tools for challenging geographical assumptions and delivering high-impact visual statements.
Anatomy of a Well-Designed Thematic Map
Creating an effective thematic map requires careful consideration of several fundamental cartographic elements. Without these components, a map risks becoming confusing, misleading, or entirely uninterpretable.
- The A clear, concise title is essential to immediately inform the reader of the map’s subject matter, geographic scope, and temporal context. A title should explicitly state what variable is being mapped, where the data applies, and what year the data represents.
- The Legend: Often referred to as the map’s key, the legend is the critical tool that allows viewers to decode the visual variables used on the map. It explains what each color, symbol size, or pattern represents, establishing the relationship between the graphic elements and the actual statistical values.
- Map Scale and Orientation: Although less prominent on thematic maps than on reference maps, a scale bar and orientation indicator (such as a north arrow) remain important for providing geographic context and helping viewers understand the spatial proportions of the region shown.
- Data Classification: How data is grouped into ranges or classes has a profound impact on the map’s final appearance. Cartographers must choose classification methods—such as natural breaks, equal intervals, or quantiles—that accurately reflect the underlying distribution of the data without introducing artificial bias.
- Data Source and Metadata: Credibility is paramount in data visualization. Every professional thematic map should clearly cite the source of its data, allowing viewers to verify the accuracy of the information and understand the methodology behind its collection.
Real-World Applications Across Industries
The utility of thematic mapping extends far beyond academic geography, influencing operational strategies and policy decisions across a wide spectrum of professional fields.
In public health, thematic maps are used to track the spread of infectious diseases, identify regions with low vaccination rates, and map access to healthcare facilities. By overlaying health outcomes with socioeconomic indicators, public health officials can pinpoint systemic disparities and target interventions more effectively.
In environmental science, researchers rely on thematic maps to monitor deforestation, track wildlife migration patterns, and visualize the local impacts of climate change, such as desertification or rising sea levels. These visualizations are critical for communicating scientific findings to the public and convincing governments to adopt sustainable environmental policies.
In business and market research, corporations utilize thematic mapping to analyze consumer demographics, assess competitor density, and optimize supply chain logistics. A retailer looking to open a new location can map household income levels and foot traffic patterns to identify the most lucrative real estate options.
In humanitarian aid and emergency management, thematic maps are deployed during crises to coordinate relief efforts. By mapping damaged infrastructure, flooded areas, and the locations of displaced populations, emergency responders can allocate food, medical supplies, and rescue teams to the areas of greatest need.
The Double-Edged Sword: Advantages and Limitations
While thematic maps are incredibly powerful tools for communication, they are not without their challenges. Understanding both their strengths and their limitations is essential for both creators and consumers of spatial data.
Advantages
The primary advantage of thematic maps is their ability to simplify massive volumes of complex data, transforming abstract numbers into immediate visual patterns. They excel at highlighting spatial anomalies, regional disparities, and geographical correlations that would remain invisible in a standard spreadsheet. Furthermore, because humans are highly visual creatures, thematic maps are exceptionally engaging, making them highly effective tools for education, advocacy, and public relations.
Limitations
Despite their utility, thematic maps can easily mislead—either intentionally or accidentally. A major limitation is the Modifiable Areal Unit Problem (MAUP), which occurs when the aggregation of data into arbitrary administrative boundaries (such as zip codes or counties) distorts the actual spatial patterns of the underlying phenomenon.
Additionally, the selection of color schemes and data classification ranges can drastically alter the story a map tells. By shifting the boundaries of a data class, a cartographer can make a problem look far more severe or entirely negligible. Finally, thematic maps run the risk of oversimplifying highly complex, multifaceted issues, presenting a static snapshot of dynamic systems that are constantly in flux.
The Modern Mapping Toolkit
The creation of thematic maps has been profoundly democratized by the advent of modern software and digital technology. What once required highly specialized cartographic training and manual drafting can now be accomplished using intuitive digital platforms.
For professional geographers and data analysts, Geographic Information Systems (GIS) software remains the gold standard. Programs like QGIS (an open-source platform) and ArcGIS (a widely used commercial software) offer unparalleled tools for spatial analysis, data manipulation, and cartographic design. These systems allow users to layer diverse datasets, run complex spatial queries, and generate highly customized thematic maps.
For business analysts, journalists, and beginners, data visualization platforms like Tableau and web-based mapping applications have made map creation accessible to non-technical users. These tools offer user-friendly, drag-and-drop interfaces that can quickly turn spreadsheets into interactive, web-ready thematic visualizations. Additionally, programming languages like R and Python feature robust libraries dedicated to spatial data science, allowing developers to automate the mapping process and integrate spatial visuals directly into broader data pipelines.
FAQs: Understanding Thematic Maps
What is the difference between a thematic map and a reference map?
A reference map focuses on displaying the locations of diverse geographic features, such as roads, rivers, political boundaries, and cities, primarily to aid navigation and spatial orientation. In contrast, a thematic map is dedicated to illustrating a specific theme or subject—such as average rainfall, population distribution, or economic statistics—using geographic boundaries merely as a background framework to show spatial patterns.
Can thematic maps be used for historical data?
Yes, thematic maps are highly effective tools for visualizing historical trends and changes over time. By mapping historical datasets, researchers can visually track phenomena such as territorial expansions, demographic migrations, shifts in industrial production, or the spread of agricultural practices across different historical eras.
What software is best for beginners to create thematic maps?
For those new to cartography and spatial data visualization, platforms like Tableau and QGIS are excellent starting points. Tableau offers an intuitive, user-friendly interface that excels at creating quick, interactive charts and maps from structured data tables. QGIS, being a free and open-source desktop GIS, provides a more comprehensive introduction to professional geographic analysis and cartographic design without the financial barrier of commercial software.
How do I choose the right type of thematic map for my data?
The choice depends entirely on the nature of your data and the story you want to tell. Continuous data that transitions smoothly across space (such as temperature or elevation) is best represented using isoline maps. Categorical data or normalized rates linked to administrative boundaries (like literacy rates by country) are ideal for choropleth maps. If you want to show absolute quantities at specific points without being constrained by regional boundaries, proportional symbol maps are often the most effective choice.
Are thematic maps only used in geography?
No, thematic maps are utilized across a vast array of disciplines far beyond traditional geography. They are essential tools in public health, market research, urban planning, environmental science, economics, political science, and journalism, allowing professionals in these fields to uncover spatial correlations and present data-driven arguments clearly.