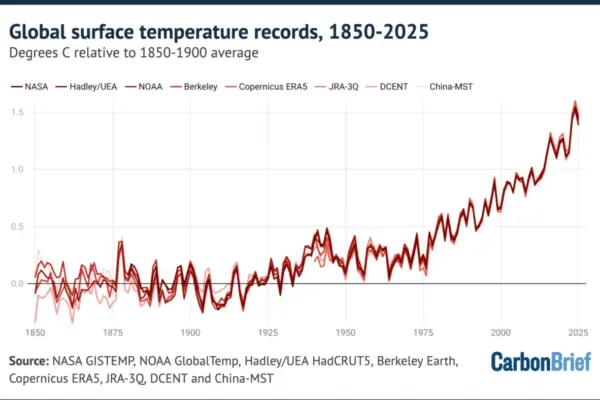
The climate phenomenon known as El Niño has officially entered unprecedented territory for this time of year, with tropical Pacific sea surface temperatures surpassing the daily records set during the historic event of 2015.
El Niño is a naturally occurring climate pattern originating in the tropical Pacific Ocean that significantly reshapes weather systems across the globe while temporarily driving up global surface temperatures. The current event, which initially took shape in June and is projected to persist well into next year, has developed at a pace faster than any previously recorded episode in meteorological history.

To track the magnitude and intensity of these events, scientists rely on the Niño 3.4 anomaly index. This metric measures the degree to which sea surface temperatures in a specific section of the central Pacific exceed the historical average. As of September 21, the daily anomaly in the Niño 3.4 region reached an astounding 3.11 degrees Celsius, officially eclipsing the previous daily high of 3.08 degrees Celsius set on November 18, 2015.
Some researchers utilizing alternative baseline calculations had already flagged the approaching milestone days in advance. Regardless of the specific baseline applied, the rapid escalation is remarkably unusual, largely due to how early it is materializing in the calendar year. El Niño cycles typically reach their peak intensity during the Northern Hemisphere winter months, most commonly in November or December. Historically, every strong El Niño event on record has continued its intensification trajectory past mid-September, giving researchers every reason to believe that the current phenomenon will follow a similar path.
Record Territory
Within the scientific community, El Niño events are conventionally classified by their intensity based on the Niño 3.4 anomaly thresholds. An event is typically designated as "weak" when anomalies reach 0.5 degrees Celsius, "moderate" above 1.0 degree Celsius, "strong" above 1.5 degrees Celsius, and "very strong" when anomalies surpass 2.0 degrees Celsius.
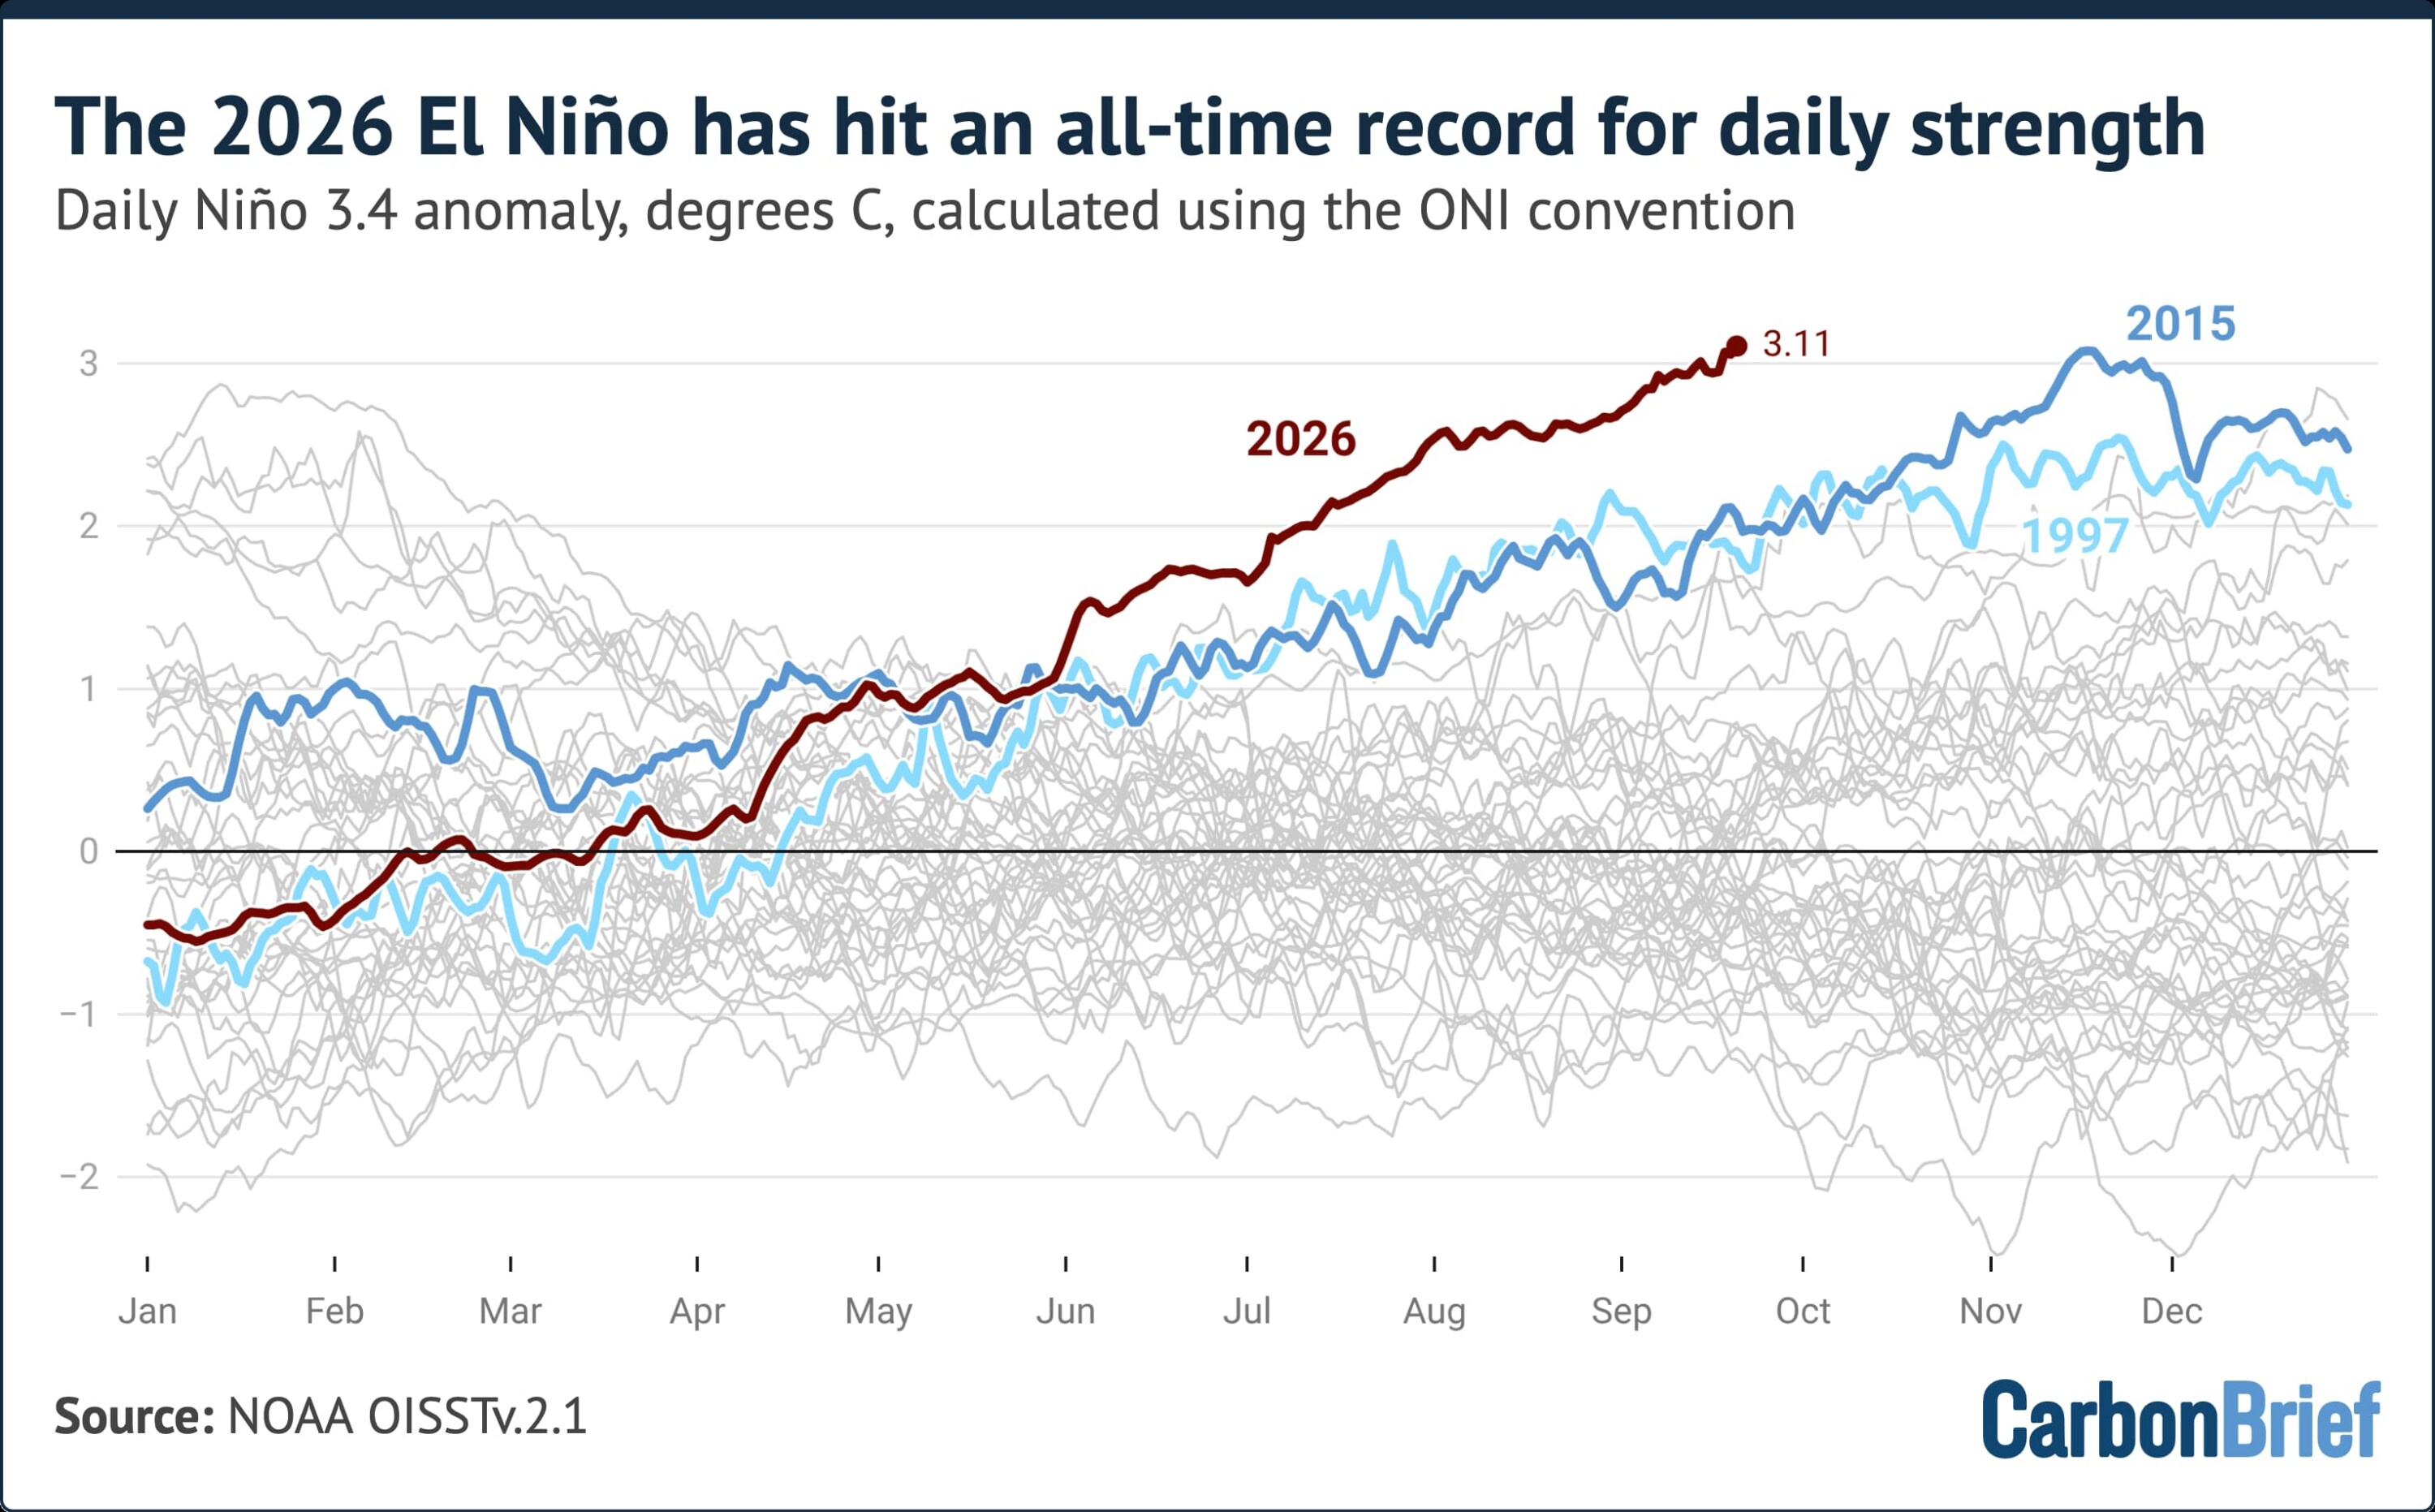
With this year’s anomaly climbing to 3.11 degrees Celsius, the current event has comfortably surpassed the threshold for a very strong classification, breaking the benchmark established during the intense 2015-16 cycle. Historical tracking demonstrates that the current event’s strength is dramatically outpacing both the 2015-16 cycle and the legendary 1997-98 event, which was also categorized as very strong.
To analyze the developing pattern, researchers commonly follow the convention of the US National Oceanic and Atmospheric Administration’s Oceanic Niño Index. The ONI is calculated by subtracting the most recent 30-year average temperature in the Niño 3.4 region from daily sea surface temperatures. This analytical approach allows modern years to be measured against a contemporary climate baseline, effectively removing much of the influence of long-term, human-driven global warming from the raw index. While meteorological organizations traditionally track changes to the ONI on a three-month rolling average basis, recent analytical studies have closely monitored how the metric shifts on a daily basis.
When calculated using a standard baseline of 1991 to 2020, the current El Niño has already secured a definitive all-time record. Since the beginning of June, the event’s measured strength has outstripped any comparable period in historical records. By early September in both 1997 and 2015, respective anomalies hovered around 1.9 degrees Celsius—sitting more than a full degree cooler than observed readings for the same timeframe this year.
An Alternative Index
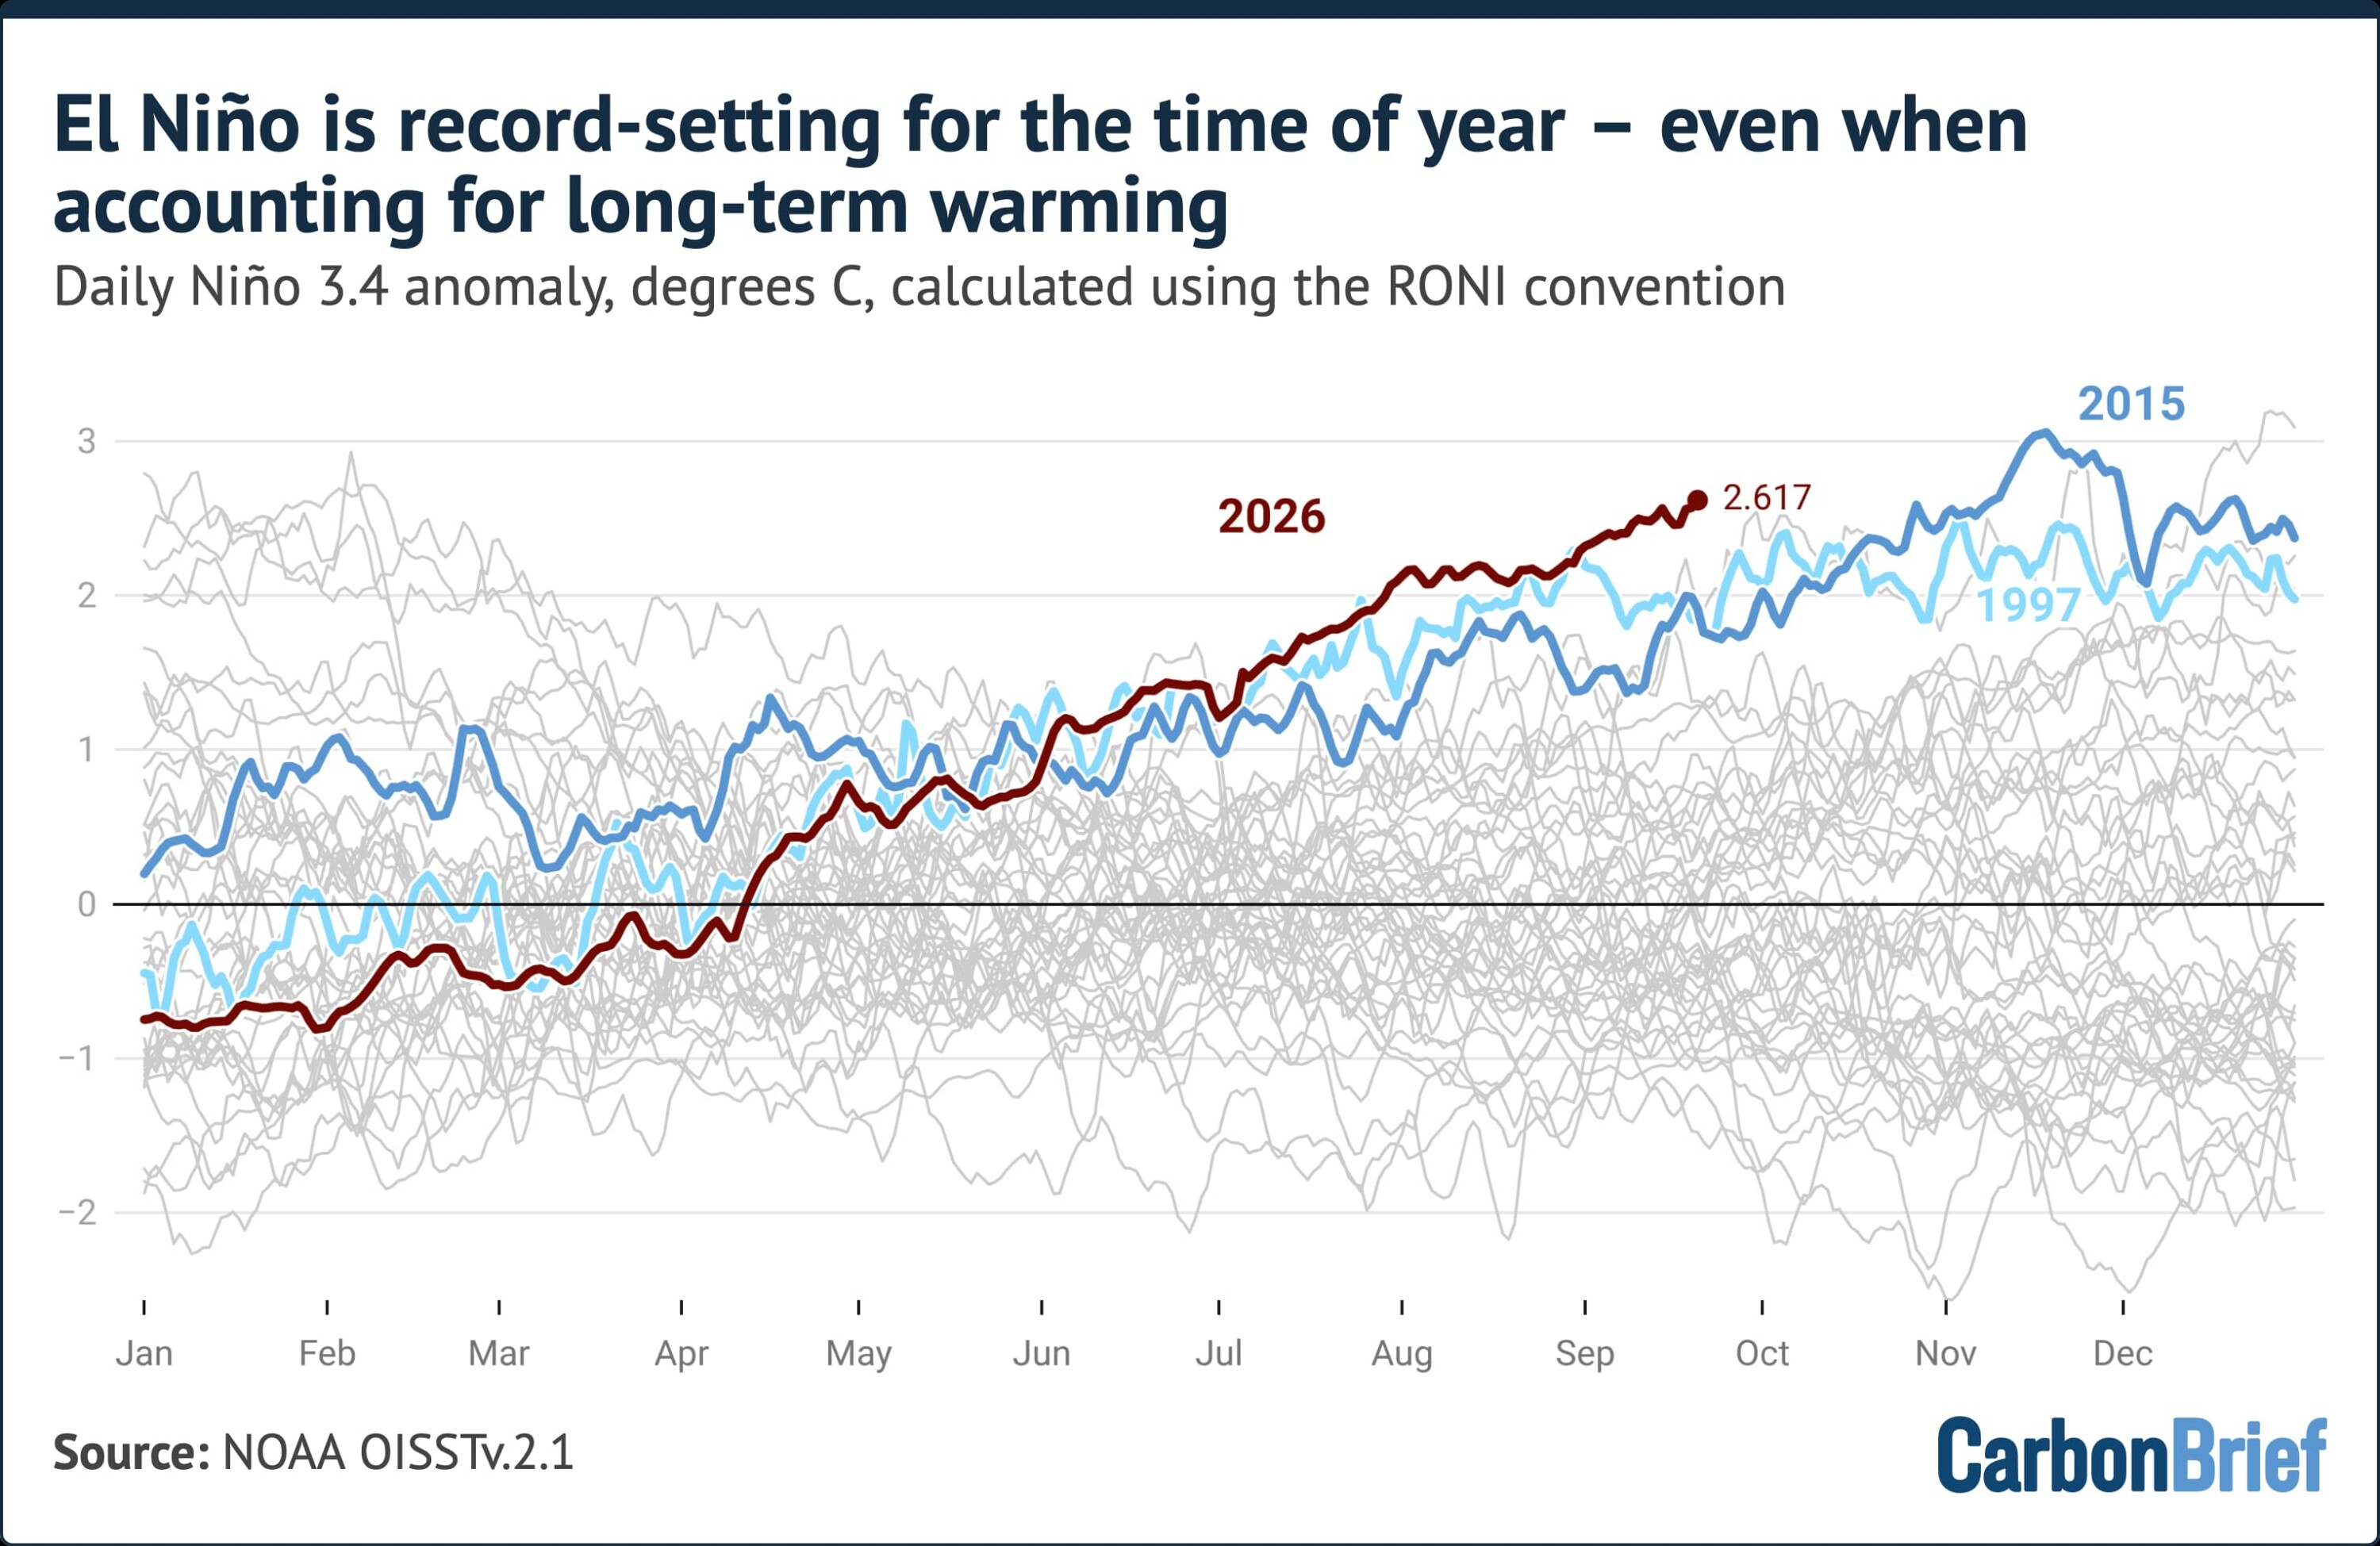
To gain a more comprehensive understanding, scientists also utilize an alternative metric known as the relative Oceanic Niño Index, or RONI. Introduced by NOAA, the RONI index adjusts specifically for broader tropical ocean warming trends linked to human-caused climate change. To achieve this adjustment, the metric takes sea surface temperature averages in the Niño 3.4 region and subtracts out temperature anomalies observed more broadly across the tropical oceans between the latitudes of 20 degrees north and south.
While this methodology successfully removes broader background climate change signals from the localized region, it can also diminish the apparent statistical strength of exceptionally potent El Niño events, particularly those like the current one that extend far beyond the immediate boundaries of the Niño 3.4 region.
Daily RONI values remain at record-setting levels for this specific point in the calendar year, though they currently sit below the absolute daily record established during the severe 1982-83 El Niño event. In mid-September, the RONI reading stood at approximately 2.5 degrees Celsius, sitting about 0.7 degrees Celsius below the 1982 peak. However, that historical benchmark was achieved in late December at the absolute height of the event. Historical data from the 1982-83, 1997-98, and 2015-16 events show that anomalies typically add between 0.5 and 1.9 degrees Celsius to their RONI values between mid-September and their eventual winter peaks.
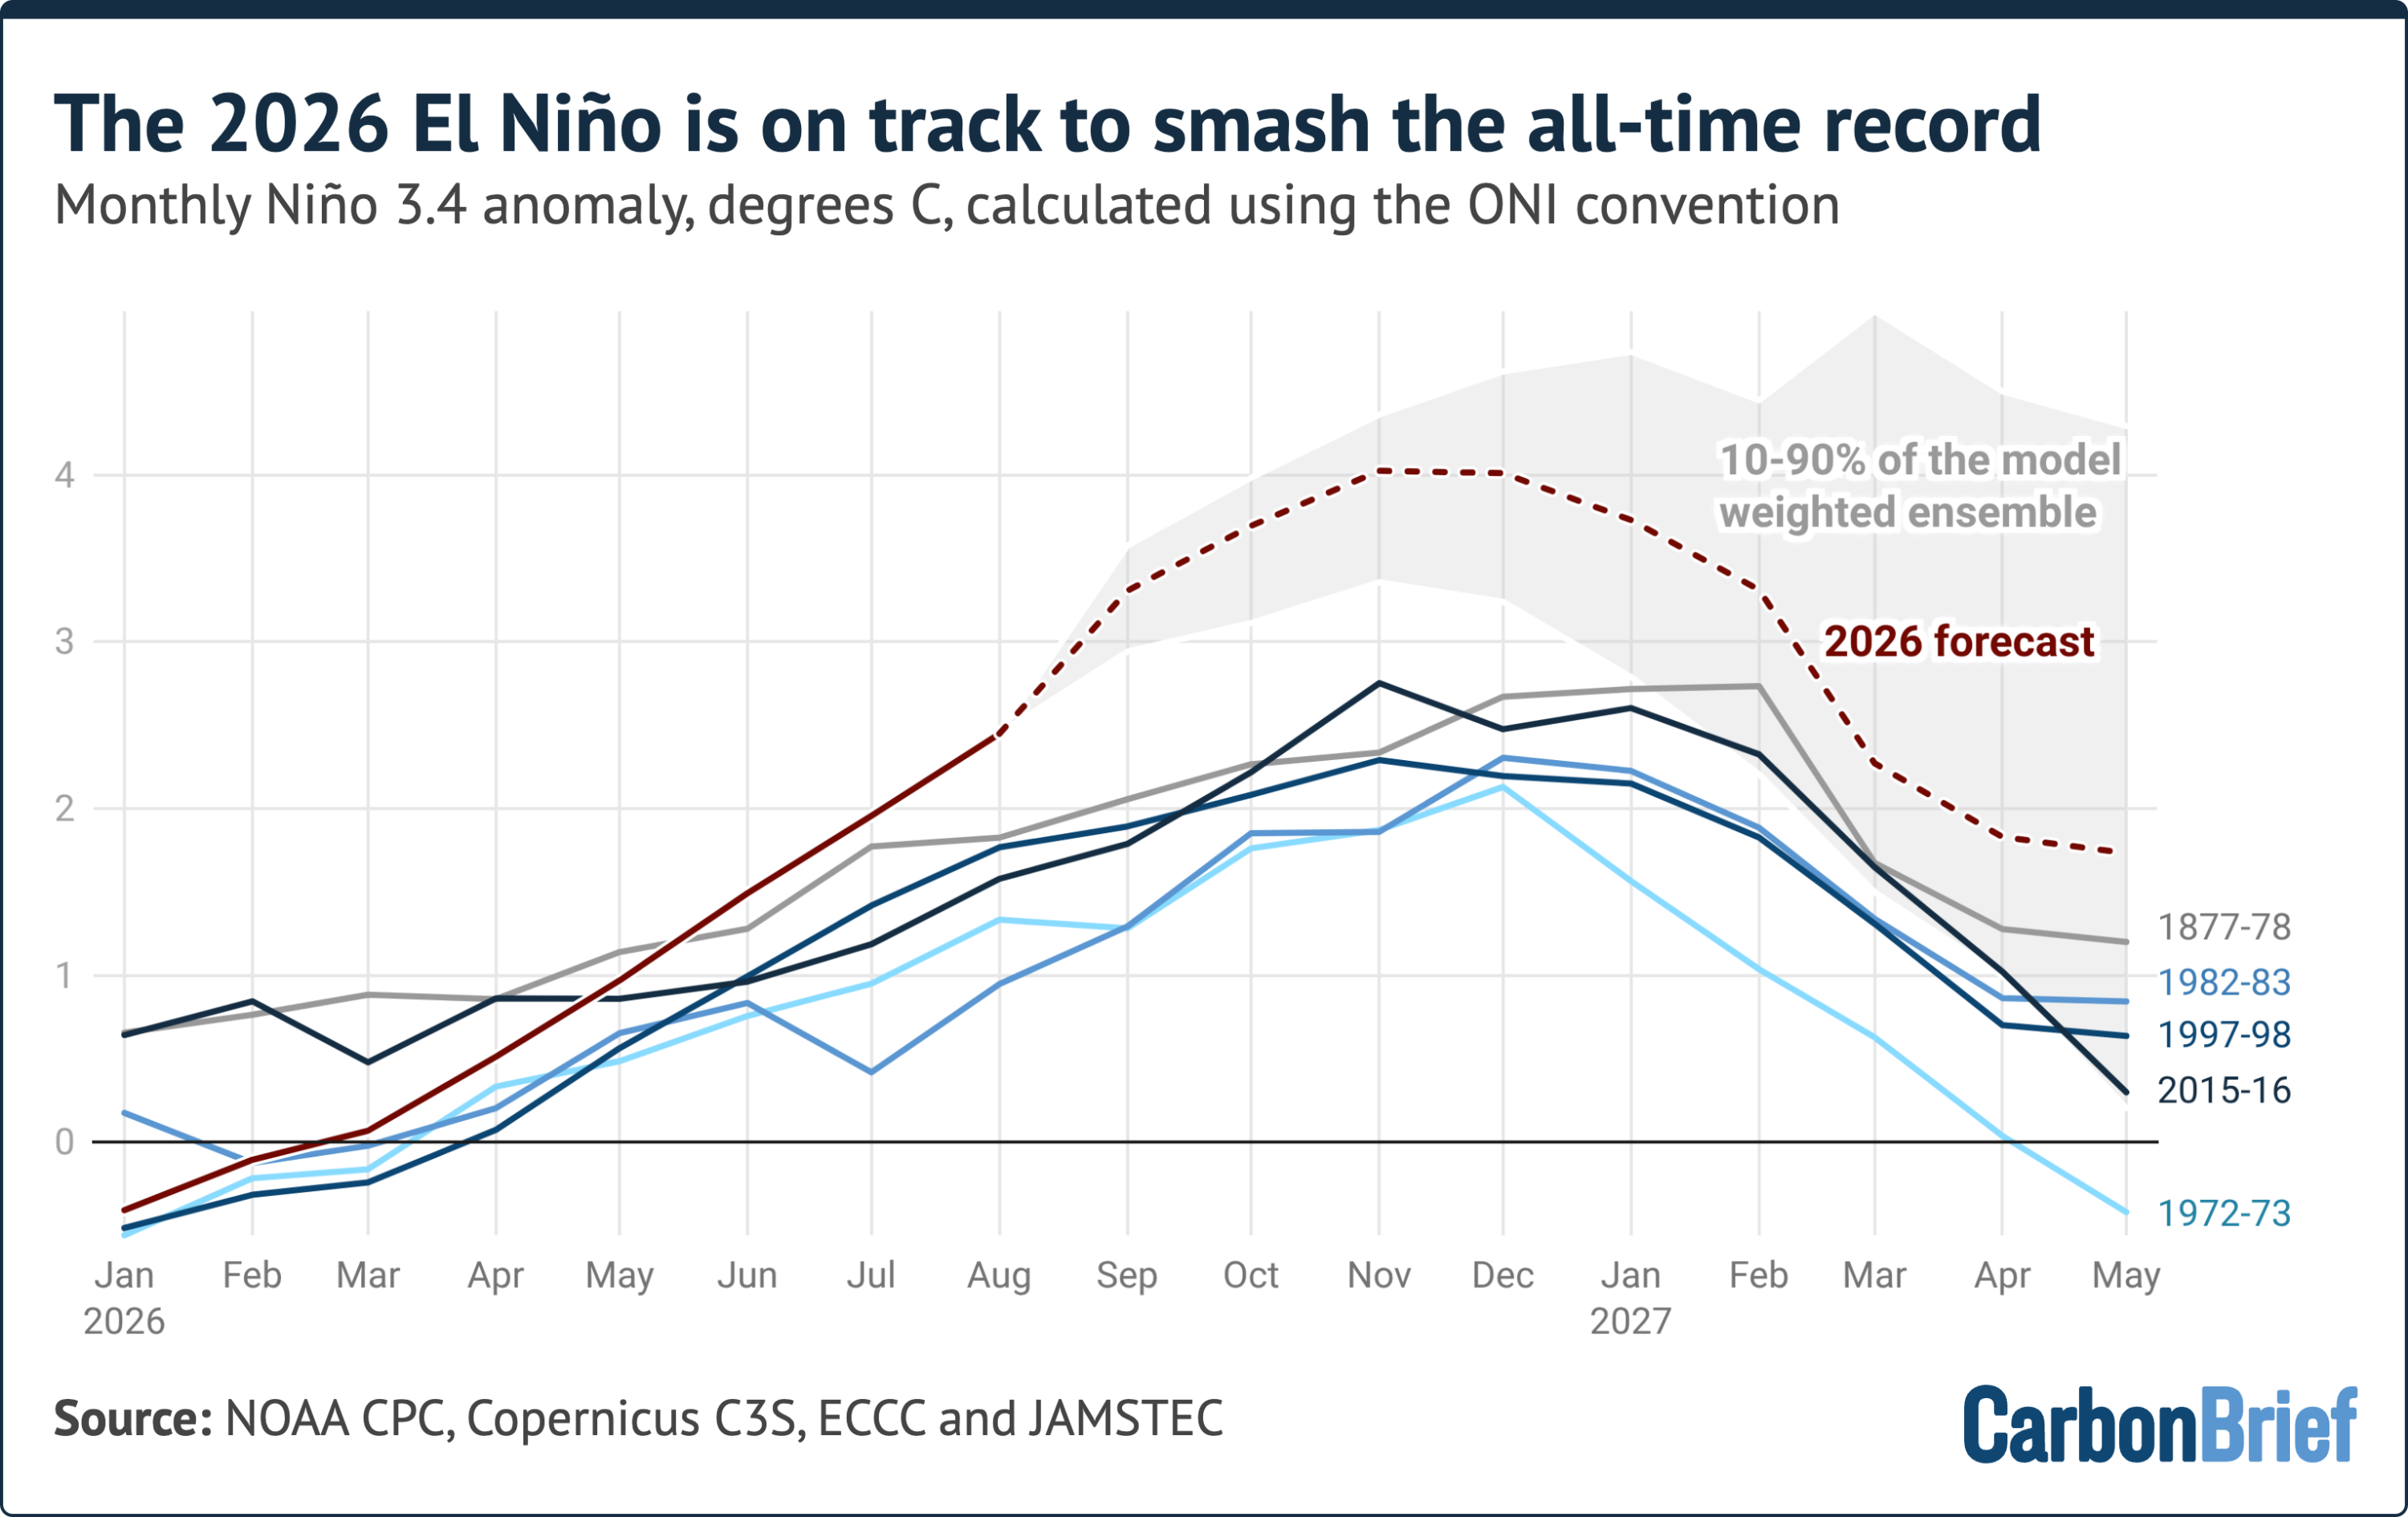
On Track to Smash Monthly and Seasonal Records
Because daily El Niño metrics can exhibit significant short-term variability, researchers primarily rely on monthly or seasonal averages to evaluate and compare different events over time. The most recent full calendar month with finalized data, August 2026, registered a Niño 3.4 anomaly of approximately 2.45 degrees Celsius. This figure exceeds the ultimate peak of nearly every prior recorded El Niño event, with the sole exceptions being the 2015-16 cycle—which peaked at an anomaly of 2.75 degrees Celsius—and a historical reconstruction of the 1877-78 event based on sparse ship log data, which estimated anomalies at roughly 2.7 degrees Celsius.
Projections synthesized from multiple seasonal forecast models indicate that the monthly anomaly will continue to climb, pointing toward a potential peak later in the year of around 4.1 degrees Celsius. Approximately 80 percent of individual model runs project peaks falling between 3.4 and 4.6 degrees Celsius.
Significantly, every single model run projects a peak that exceeds the record established during the 2015-16 event. The projected margin over that previous record—roughly 1.3 degrees Celsius—is larger than the entire numerical gap that separates the strongest and fifth-strongest El Niño events recorded over the past century and a half.

Climate scientists emphasize that a degree of caution remains necessary when interpreting these forecasts. No seasonal forecasting system has ever been tested or verified against an event of this unprecedented magnitude because one has not occurred during the modern instrumental era. Furthermore, models exhibited a slight warm bias during the summer months, with real-world observations for August coming in approximately 0.3 degrees Celsius below model projections.
Nevertheless, historical precedent shows that all strong El Niño events continue to intensify well into the winter season, and meteorological models remain in near-unanimous agreement that the current event will follow suit. Should these forecasts hold true, the unfolding phenomenon will peak between November and January at levels far exceeding any event documented in observational history.
Because the atmospheric and global temperature impacts of El Niño typically lag behind rising ocean temperatures in the Pacific by several months, the most profound global weather disruptions and temperature anomalies are expected to materialize in 2027 rather than 2026. Ongoing quarterly climate assessments indicate that 2026 is already firmly on track to rank among the warmest years on record globally, with upcoming analyses poised to examine what a record-shattering El Niño implies for global climate patterns in the year ahead.