When professionals sit down to communicate with data, the vast majority of their energy is typically funneled into perfecting the graphs themselves. Countless hours are spent debating which chart type best represents a dataset, agonizing over precise labeling choices, or deciding what specific data points deserve highlighting. Yet, despite this intense focus on the visual core of a presentation, another critical decision frequently gets overlooked: how the slide itself is structured.
The overall layout of a presentation slide—determining precisely where a graph lives, how much breathing room text is allocated, and how the human eye naturally travels across the page—is much more than a mere aesthetic choice. It is fundamentally a communication choice. When an organization or presenter gets that layout right, the audience effortlessly follows the underlying logic of the argument. Conversely, when the layout fails, even the most impeccably designed graphs can leave viewers confused, distracted, and missing the broader point.
To understand why layout plays such a decisive role in data communication, it helps to look at the concept of vertical logic. This core principle dictates that all information presented on a given slide should be entirely self-reinforcing. In a vertically logical slide, the surrounding content reinforces the title, and the title in turn validates the content. The accompanying words reinforce the visual elements, and the visual elements validate the words. There is nothing extraneous and nothing unrelated included on the page. Instead, the layout creates a clear, unobstructed cognitive flow where a reader’s understanding deepens organically with every single element they encounter.
The foundational ideas behind vertical logic, along with its companion concept horizontal logic, are explored in depth within the bestselling professional resource storytelling with data: a data visualization guide for business professionals. Building directly on these concepts, colleague Alex expands on the framework in the follow-up release storytelling with data: before & after, which introduces practical, go-to layouts designed to put vertical logic into real-world practice. The visual structures and strategic examples discussed in professional communications circles often trace back to the methodologies detailed in these texts.
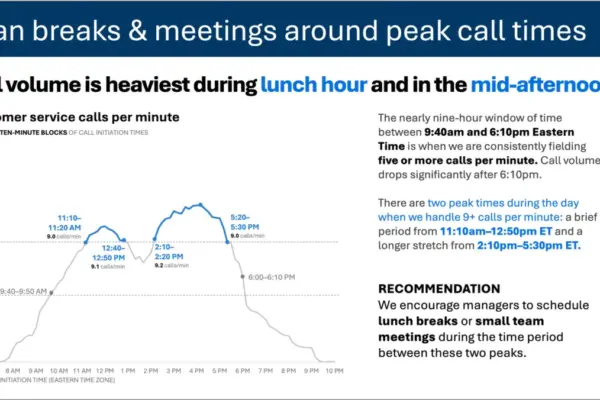
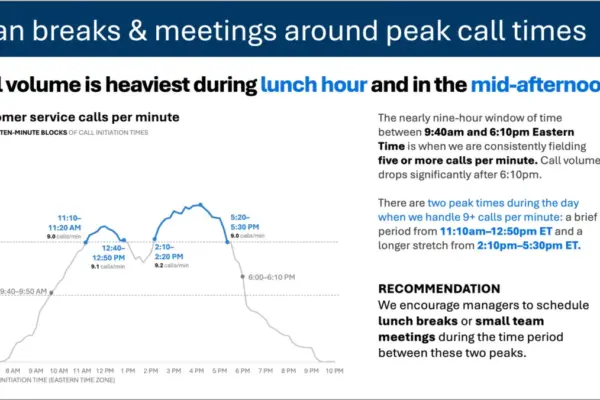
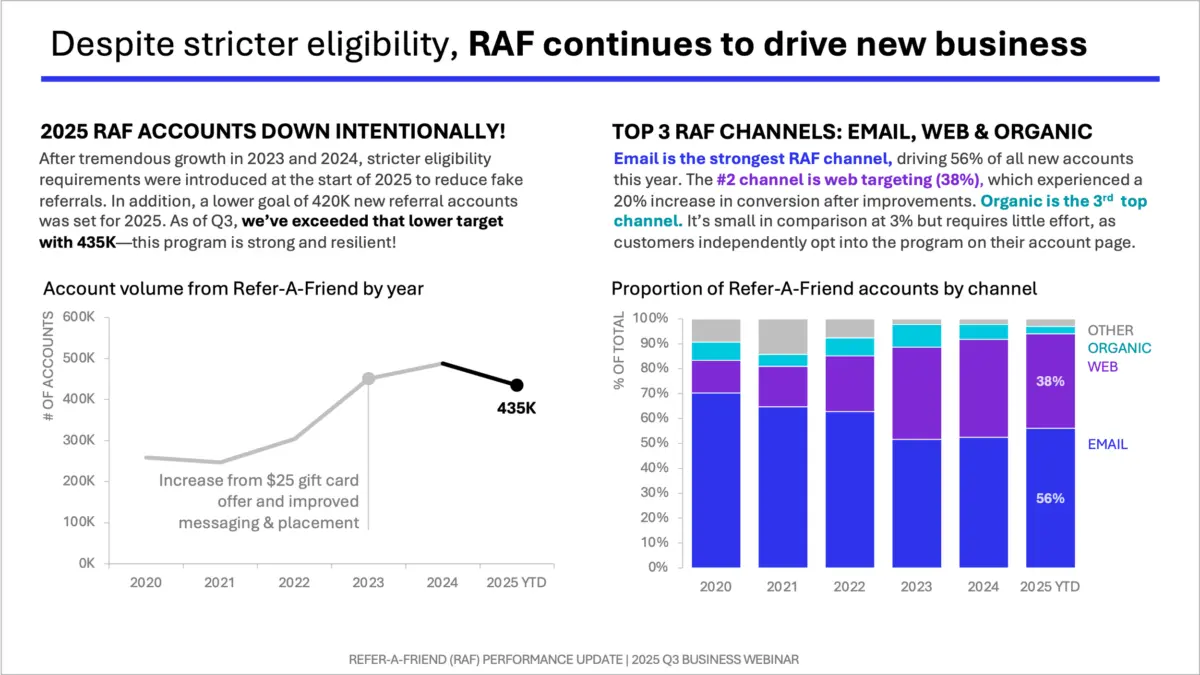
Among these structural frameworks, the one-sided layout stands out as a powerful tool for presenters looking to maximize clarity. This specific layout gives a single, dominant graph a large and prominent position on the slide, leaving dedicated space for explanatory text arranged across the top and down the right side. This architectural approach deliberately leverages what cognitive scientists call the picture superiority effect—the well-documented phenomenon wherein human beings notice images faster, understand them much more easily, and retain them significantly longer than words presented entirely on their own.
By utilizing the one-sided layout, a presenter is essentially instructed to lead with the visual, allowing the graph to do the heavy lifting of carrying the core message. The surrounding text is then deployed strategically to frame that visual, adding necessary context and reinforcing the key takeaway. In professional applications such as those demonstrated in storytelling with data: before & after, this structure proves particularly effective when an organization needs to communicate a succinct marketing recommendation or a high-stakes strategic decision without overwhelming the audience with competing visual noise.