Nestled against the rugged backdrop of the Pacific Northwest, life offers a striking visual definition of peaks, valleys, and the spaces in between. With rocky beaches, hidden waterways, uninhabited islands, and dense mountain ranges often veiled in seasonal fog, the region serves as a dramatic reminder of nature’s contours. For local residents who spend summer weekends hiking Washington’s sweeping mountain ranges, journeys often culminate in rewarding destinations like waterfalls. The Pacific Northwest provides an ideal setting for such outdoor pursuits, as Washington State alone is home to more than 2,900 waterfalls, including the tallest waterfall in the continental United States.
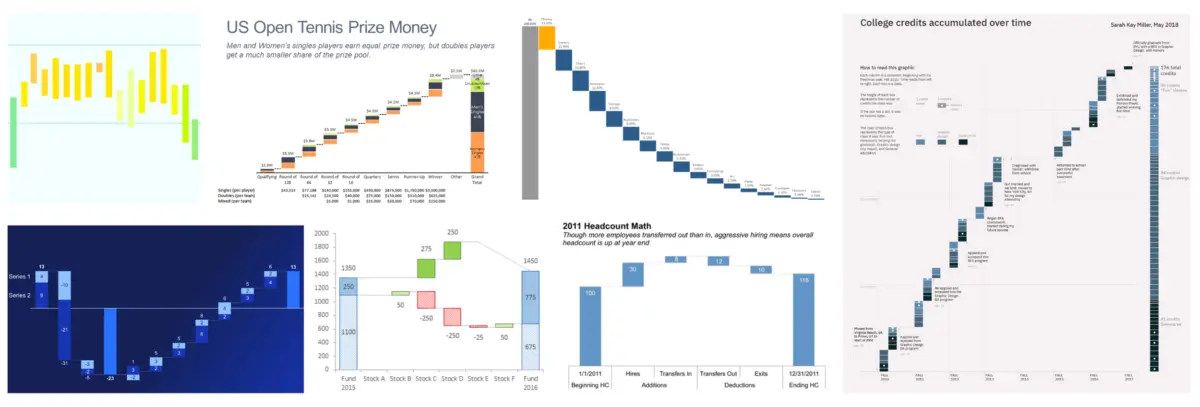
Immersed in this inspiring natural environment, a recent waterfall hike prompted a reflection on one of the most effective and visually compelling analytical tools used in the professional world: the waterfall chart. These specialized charts serve as powerful instruments for data storytelling because they clearly illustrate a sequential progression. They effectively show where an analysis started, what specific factors changed along the way, and where the metrics ultimately ended up.
Although the global data community previously tackled waterfall charts in a challenge several years ago, the demand for a fresh look and renewed creativity remains high. Historically, these analytical displays have proven invaluable for financial breakdowns, sales performance reviews, and cause-of-change analyses. However, their utility extends far beyond traditional corporate finance. Professionals frequently leverage waterfall charts to track human resources headcounts, monitor subscription metrics and customer churn, or even chart score changes over the course of a competitive sports match.
The versatility of the chart style makes it particularly effective for live presentations and walkthroughs. During a live session, a presenter can easily pause to discuss crucial intermediate bars in the middle section of the chart, addressing anomalies or significant shifts in the data. At the same time, the unique structure of a waterfall chart provides valuable white space in written communications, allowing readers to digest complex numerical narratives without feeling overwhelmed by cluttered visuals. Driven by curiosity regarding the diverse ways professionals apply this visualization technique, the organization has officially launched a brand-new monthly challenge dedicated entirely to the format.
The Challenge
The core objective of the latest community initiative is simple yet open-ended: participants are invited to design and share their own waterfall chart. Analysts and visualizers are welcome to use their own proprietary data, draw from a wide selection of publicly available datasets, or simply practice their skills using a classic example provided by the Storytelling with Data framework. As is standard practice for professional data presentation, participants are strongly reminded to completely anonymize any sensitive information that cannot be shared publicly before publishing their work.
For those who may be new to the format or looking to refine their technical skills, a curated collection of foundational resources has been compiled to assist with building effective waterfall charts and navigating important design considerations. The overarching goal is to encourage creators to craft a data narrative that inspires them, whether the subject matter tackles serious corporate forecasting or a lighthearted, fun topic.
Participants eager to take part in the August event must submit their finished waterfall chart stories through the designated online community platform by August 31 at 5:00 PM Pacific Time. Creators who are looking for constructive input are also encouraged to include specific questions or details regarding the type of feedback they would find most helpful, fostering a collaborative environment for continuous professional growth within the global data community.