In an increasingly data-driven world, maps have evolved far beyond basic navigation tools designed to guide travelers from one point to another. Modern spatial analytics relies on mapping as a sophisticated medium for storytelling, pattern recognition, and geographic problem-solving. While general reference maps outline physical geography, such as roads, rivers, and political boundaries, thematic maps serve a distinctly specialized purpose. By visualizing specific data themes against a geographic backdrop, these powerful tools allow researchers, analysts, and decision-makers to distill complex information into clear spatial narratives.
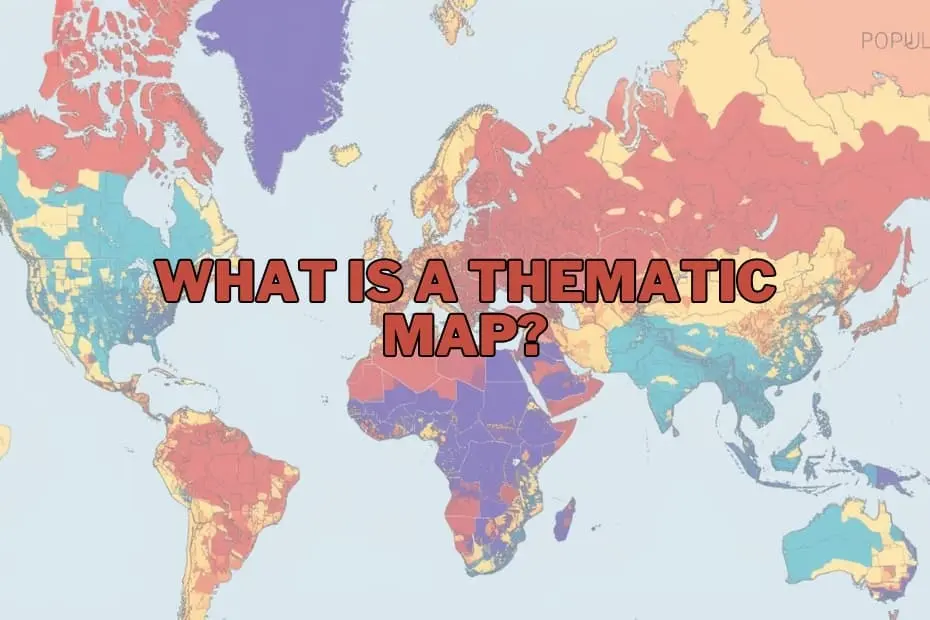
A thematic map is defined as a specialized graphic representation designed to illustrate visual data tied to a distinct subject or theme within a defined geographic region. Rather than focusing on topographical details or navigational markers, thematic maps emphasize spatial patterns and distributions. Whether depicting population density, climate shifts, income disparity, or economic output, these visualizations employ targeted color gradients, standardized symbols, and controlled shading to highlight trends, concentrations, and spatial anomalies across geographic regions.
Purpose and Importance of Thematic Maps
The fundamental purpose of a thematic map is to communicate complex spatial information clearly and efficiently. Raw tabular data often obscures critical spatial patterns, making it difficult to discern how phenomena interact across physical space. By translating statistical metrics into visual patterns, thematic maps reveal hidden relationships, regional variations, and environmental distributions that might otherwise remain unnoticed in spreadsheet rows.
The strategic importance of thematic mapping spans across diverse professional domains. Government officials rely on these maps to assess population growth and allocate civic resources effectively. Environmental scientists utilize spatial distributions to track how climate change influences agricultural productivity, ecosystem shifts, and seasonal weather events. Similarly, business analysts deploy thematic maps to evaluate market penetration, consumer behavior, and regional economic performance. By converting dense datasets into intuitive visual intelligence, thematic maps provide actionable insights that directly inform policy, scientific research, and commercial strategy.
Types of Thematic Maps
Cartographers and data analysts utilize several distinct categories of thematic maps depending on the underlying data structure and the spatial narrative being conveyed. Choosing the appropriate map type is essential for accurately portraying statistical variables without misinforming the audience.
Choropleth maps are among the most widely recognized thematic map styles. These maps utilize varying color tones, shades, or patterns within predefined geographic boundaries—such as census tracts, counties, or nations—to represent statistical quantities. Choropleth mapping is particularly effective for visualizing standardized metrics, such as population density, median household income, or literacy rates across established administrative zones.
Dot density maps employ uniform dots or symbols across a geographic region to represent specific quantities of a phenomenon. Each dot corresponds to a predetermined unit value, such as one dot representing one hundred residents or a specific number of agricultural yields. This technique provides a clear visual depiction of spatial concentration and scatter without relying strictly on administrative shading, making it useful for mapping demographics, livestock distribution, or crop yield intensity.
Proportional symbol maps display symbols—most commonly circles or squares—scaled in direct proportion to the magnitude of the data associated with specific geographic locations. Unlike choropleth maps, which shade entire territorial zones, proportional symbol maps place scaled visual elements at designated coordinates or regional centroids. This makes them ideal for visualizing absolute totals, such as the total energy output of power plants, traffic volume at major intersections, or population counts of major urban hubs.
Isoline maps, also known as isometric or contour maps, use continuous lines to connect points of equal value across a geographic surface. These maps are designed to depict continuous spatial phenomena that transition smoothly across geography rather than stopping at artificial political borders. Common examples include isotherms for atmospheric temperature, isohyets for annual precipitation levels, and contour lines for terrain elevation, rendering isoline maps essential for meteorology, oceanography, and physical geography.
Cartograms present a unique approach to spatial visualization by intentionally distorting true geographic area or distance to reflect a specific quantitative variable. In a value-by-area cartogram, geographic units with larger numerical values—such as total national population or gross domestic product—are visually expanded, while regions with smaller values are shrunk, regardless of their actual physical acreage. This unconventional visual manipulation creates striking thematic illustrations that immediately convey global or regional disparities.
Key Elements of a Thematic Map
Designing an accurate and communicative thematic map requires strict adherence to fundamental cartographic principles. Every component of a thematic map plays a functional role in enabling accurate visual interpretation and supporting objective spatial analysis.
A precise title establishes the map’s subject matter, spatial frame, and temporal context, ensuring that viewers immediately understand what theme is being presented. Complementing the title, the legend serves as the map’s structural key. It defines the visual variables used across the map, clearly linking specific color gradients, shading patterns, symbol scales, or line values to precise quantitative intervals or qualitative categories.
Geographic scale and orientation indicators provide necessary spatial context. Scale bars allow users to measure real-world distances accurately, while orientation markers, such as a north arrow, maintain geographic alignment. Equal attention must be given to visual hierarchy and data source attribution. Visual hierarchy ensures that the primary thematic data commands immediate attention over secondary basemap details, such as reference boundaries or water bodies. Documenting reliable source metadata guarantees scientific transparency, allowing users to verify data provenance and collection methodologies.
Applications of Thematic Maps
The versatility of thematic mapping makes it indispensable across numerous scientific, commercial, and governmental sectors. As spatial data collection has expanded through remote sensing and mobile tracking, the practical applications for thematic maps have expanded exponentially.
In public health and epidemiology, thematic maps play a vital role in monitoring disease outbreaks, tracking vector pathways, and mapping healthcare accessibility. By overlaying infection counts or health metrics onto demographic basemaps, health organizations can identify vulnerable communities and target medical interventions effectively.
Urban planners and municipal agencies utilize thematic maps to manage city infrastructure, analyze land-use zoning, and direct municipal transit expansions. By visualizing localized housing density, traffic congestion patterns, and service coverage gaps, civil planners can make informed decisions regarding future development projects.
In environmental science and natural resource management, thematic mapping supports climate modeling, coastal erosion tracking, and forest conservation efforts. Visualizing environmental metrics—such as annual rainfall variability, carbon emissions intensity, or deforestation rates—allows environmental scientists to evaluate ecological degradation and model future environmental outcomes.
Market researchers and corporate strategists depend on thematic mapping for demographic targeting, site selection, and logistics optimization. Visualizing regional purchasing power, customer concentrations, and competitor densities enables commercial enterprises to identify expansion opportunities and minimize operational risks.
Advantages of Thematic Maps
The primary advantage of thematic maps lies in their exceptional ability to simplify dense and abstract statistical datasets into easily understandable visual formats. By translating tabular numbers into spatial visuals, these maps allow viewers to synthesize complex information rapidly.
Thematic maps excel at exposing geographic trends, clusters, and spatial anomalies that traditional graphs or spreadsheets fail to capture. They facilitate direct regional comparisons, allowing decision-makers to contrast performance, risk factors, or demographic shifts across administrative boundaries. Furthermore, thematic maps serve as powerful communication tools, enabling researchers and analysts to convey intricate spatial findings clearly to non-technical stakeholders, policymakers, and the public.
Limitations of Thematic Maps
Despite their significant analytical power, thematic maps possess structural limitations that require careful cartographic design and critical visual evaluation. Recognizing these constraints is necessary to avoid misinterpreting spatial distributions or drawing inaccurate conclusions.
One major limitation stems from spatial generalization and aggregation. When data is grouped into broad administrative units—such as statewide or countywide averages on a choropleth map—internal variations within those boundaries are completely obscured. This risk, often associated with spatial aggregation bias or the modifiable areal unit problem, can create the false impression that a phenomenon is uniformly distributed across an entire region.
Additionally, thematic maps are vulnerable to visual distortion and cartographic bias if spatial parameters are improperly configured. The choice of data classification schemes, color ramps, or visual symbols can dramatically alter how a dataset appears, potentially exaggerating minor differences or masking significant spatial variances. Thematic maps are also inherently dependent on the quality and spatial resolution of the underlying dataset; inaccurate or outdated source data will inevitably yield misleading visual outputs.
Tools and Software for Creating Thematic Maps
Advancements in digital mapping technology have democratized cartography, providing accessible tools for creating sophisticated thematic maps to professionals and casual data enthusiasts alike.
Geographic Information System
(GIS) platforms represent the industry standard for professional thematic mapping and advanced spatial analysis. Software suites such as ArcGIS provide robust frameworks for managing complex spatial databases, executing geo-statistical analyses, and producing high-precision cartographic outputs. Similarly, QGIS offers a powerful, open-source GIS alternative that enables researchers and analysts worldwide to build detailed thematic visual representations without commercial licensing costs.
Beyond traditional GIS platforms, modern business intelligence and analytics tools such as Tableau have integrated spatial visualization engines. These applications allow business analysts to link dynamic corporate data directly to interactive thematic visual displays. For web developers, customizable cartographic platforms like Mapbox and Leaflet provide lightweight code libraries for embedding fluid, responsive thematic visual tools directly into online applications and digital media platforms.
Addressing Fundamental Questions in Thematic Mapping
Understanding the core functions and distinctions of thematic mapping helps clarify how spatial analytics differs from traditional geography.
What sets thematic maps apart from standard reference maps?
Reference maps focus on displaying physical location markers—such as terrain features, road networks, ocean coastlines, and geopolitical boundaries—primarily to assist with navigation and spatial orientation. Conversely, thematic maps treat geography as a baseline canvas, prioritizing the display of specific quantitative or qualitative datasets to illustrate spatial patterns and thematic phenomena.
Can thematic maps effectively visualize historical trends?
Thematic maps are well-suited for tracking temporal changes across geographical space. By rendering historical datasets—such as multi-decade demographic shifts, historical disease outbreaks, or shifting agricultural zones—cartographers can map spatial trends over time, providing valuable historical context for contemporary geographic research.
How do cartographers choose the appropriate thematic map type?
Selecting the right map format depends on the mathematical nature of the underlying data and the visualization objective. Continuous environmental datasets like temperature or elevation are best represented using isoline maps. Standardized aggregated statistics—such as median income or population density—are naturally suited for choropleth mapping, while discrete spatial counts or point locations work best with proportional symbols or dot density techniques.
Are thematic maps restricted exclusively to the field of geography?
While rooted in spatial science, thematic mapping transcends academic geography. Thematic visual analytics are routinely deployed across public health, economic forecasting, disaster response management, urban sociology, corporate real estate, and environmental engineering, proving that spatial intelligence is vital to modern interdisciplinary research and evidence-based planning.