When a projected staffing shortfall looms on the horizon, bringing the issue to executive leadership is a necessary first step. However, a high-level forecast alone rarely tells decision-makers where the underlying gap is originating from. When organizations face complex workforce trends, professionals often feel an overwhelming temptation to squeeze every single detail, metric, and cross-section into a single chart.
That exact communication challenge took center stage during a recent custom client workshop hosted by Storytelling with Data. The participating team needed to convey three distinct yet interconnected messages to their leadership: that full-time equivalent (FTE) staffing levels were expected to fall significantly below the established plan, that a noticeable decline in operations support roles constituted a critical part of that workforce shift, and that executives needed to engage in an immediate discussion to determine an effective strategy for resolving the projected staffing deficit.
While all the essential information was technically present in their original reporting materials, the core narrative was effectively buried beneath layers of visual complexity and cluttered graphic design.

Untangling the Clutter of Multi-Layered Visualizations
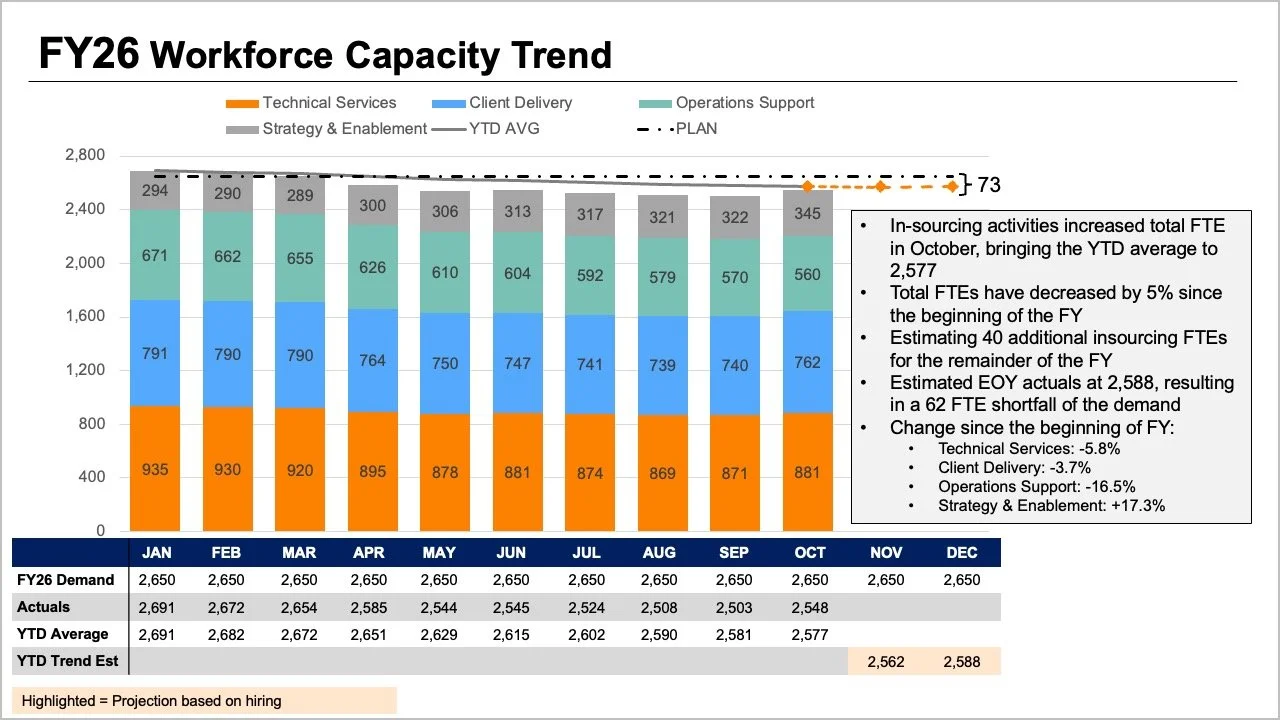
The team’s original presentation slide demanded that readers process multiple visual elements simultaneously. The tops of stacked bars, overlapping trend lines, and an accompanying data table all attempted to display overall FTE metrics in slightly different ways. Meanwhile, individual segments within the stacked bars illustrated the breakdown by specific job roles, while plans, actual figures, year-to-date averages, and forward-looking projections introduced yet another heavy layer of cognitive interpretation.
Each individual element addressed a perfectly reasonable business question, but when crammed together into a single graphic, they made it exceedingly difficult for an audience to answer any single question well. Stepping back to evaluate what executives actually require for a strategic conversation helps clarify how information should be presented. Leaders generally look for answers to two fundamental questions: How large of a shortfall should the organization realistically expect, and what do the latest staffing figures reveal about where those structural changes have occurred?
Rather than continuing to pack every available data point into one congested graph, the workshop strategy involved splitting the information into two distinct views, dedicating one focused visual to each core question.
Utilizing a Line Chart for the Overall Trend
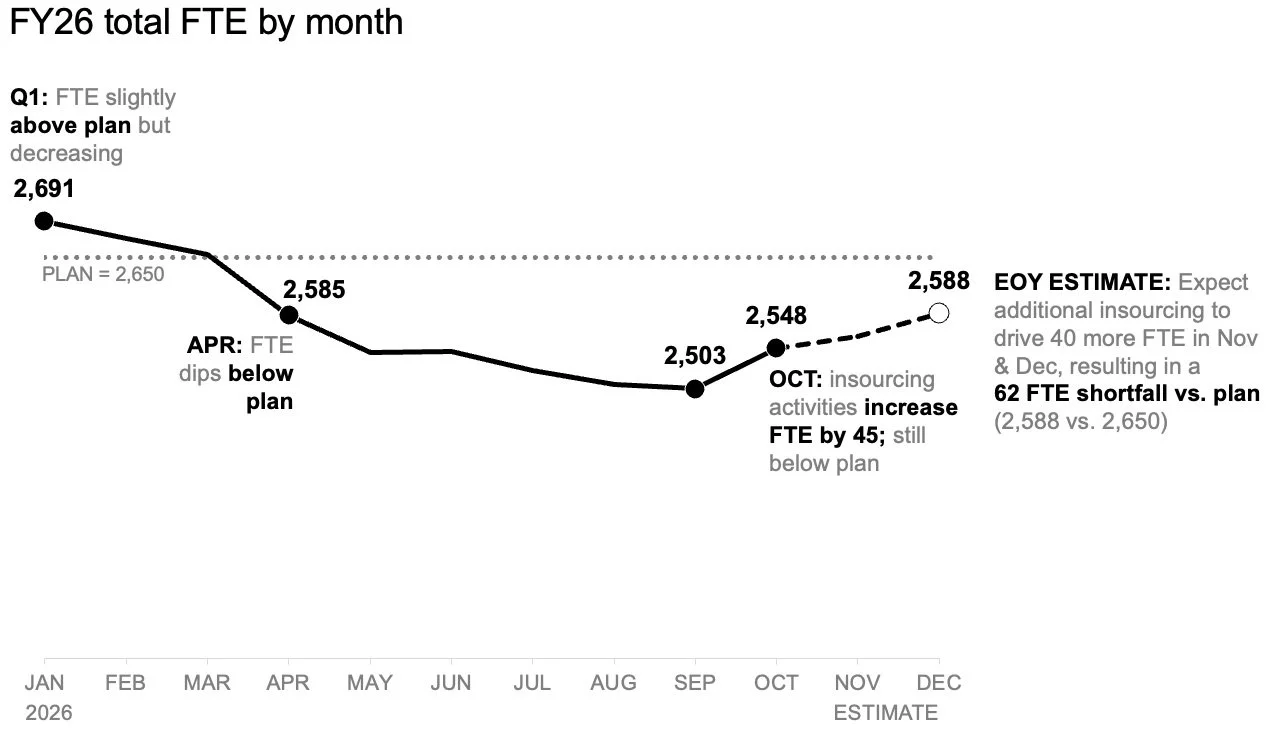
Addressing the anticipated workforce shortfall requires a dedicated approach. A standalone line chart makes it considerably easier for leadership to observe how staffing has tracked against the strategic plan set at the beginning of the fiscal year, as well as how future forecasts compare to those initial targets.
This simplified view also leaves ample visual breathing room to incorporate direct annotations at critical inflection points. Readers can immediately focus on the expected gap to plan without first needing to decode complex role mixes or scan through dense supporting data tables.
Adding a Second View for the Role-Level Breakdown
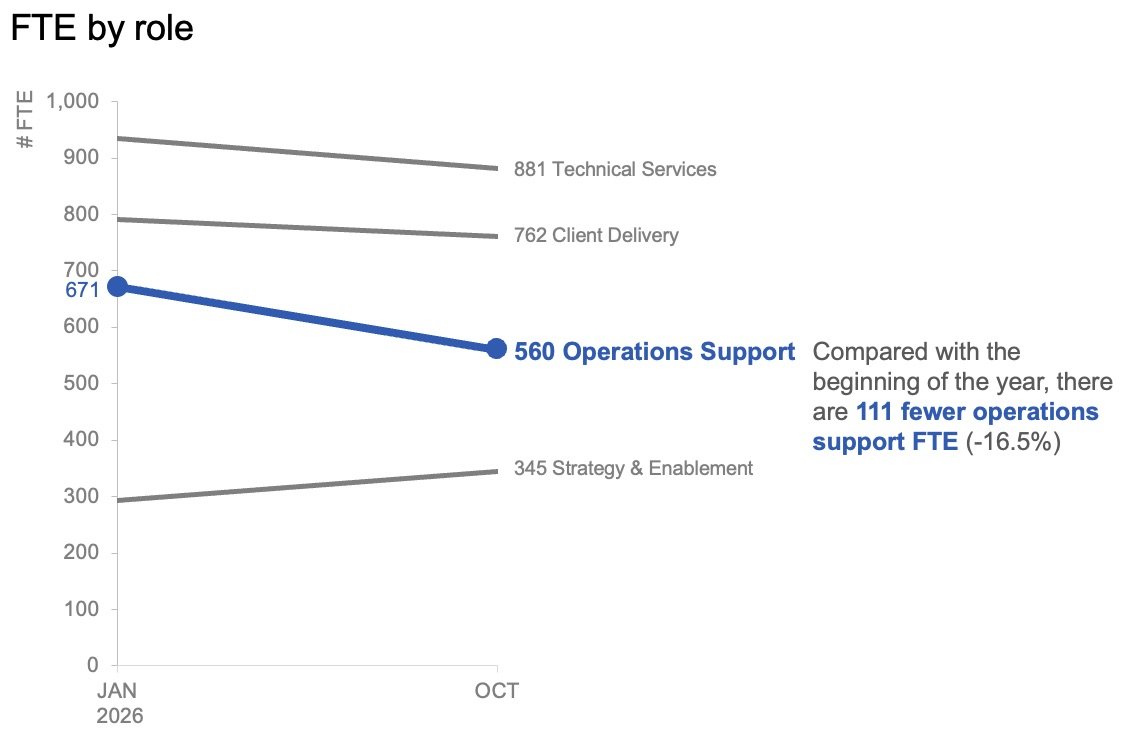
Once the overall view establishes the expected variance from the target established at the start of the year, attention can turn to role-level changes within the actual data to determine precisely where the largest operational shifts have taken place.
In this context of workforce analysis, month-to-month variations matter significantly less than the broader trajectory. Plotting only the staffing levels from the start of the year against the latest actual month using a slopegraph provides an immediate, intuitive sense of which specific roles have experienced the most substantial changes. Using color and targeted annotations sparingly helps draw the eye directly to the decline in operations support roles, enabling the audience to instantly spot the most significant operational variance.
These two visuals ultimately function as a powerful pair. The line chart answers the broader strategic question of what is happening overall, while the slopegraph answers the more granular question of which specific roles have changed the most so far.
Planning How the Narrative Will Be Shared
The format of the presentation must adapt depending on whether the information is meant to be read independently or delivered live. For a written executive summary that might be reviewed independently or forwarded without a presenter in the room, both views can comfortably sit together on a single page. A strong, takeaway-driven slide title can state the expected shortfall directly, while supporting text points explicitly to the decline in operations support roles and signals that leadership needs to discuss actionable next steps. In this layout, the charts provide robust evidence without competing for the same visual space.
For a live presentation, however, the same underlying data can be deployed through a more paced narrative sequence. Rather than asking an audience to absorb a complete summary all at once while a speaker talks over the slide, presenters can walk through the overall forecast first, then reveal the actual role-level changes piece by piece, and finally pivot the live discussion toward what needs to happen next. This deliberate sequencing allows the audience to fully absorb one critical concept before moving forward to the next.
The underlying data and the core message remain identical regardless of the delivery mechanism. The primary variable that changes is how much information the audience is asked to process at any single moment.
When comprehensive business pictures require deeper detail, the temptation to consolidate everything into a single view remains strong in the name of operational efficiency. However, simply adding more information to a page does not automatically generate deeper understanding.
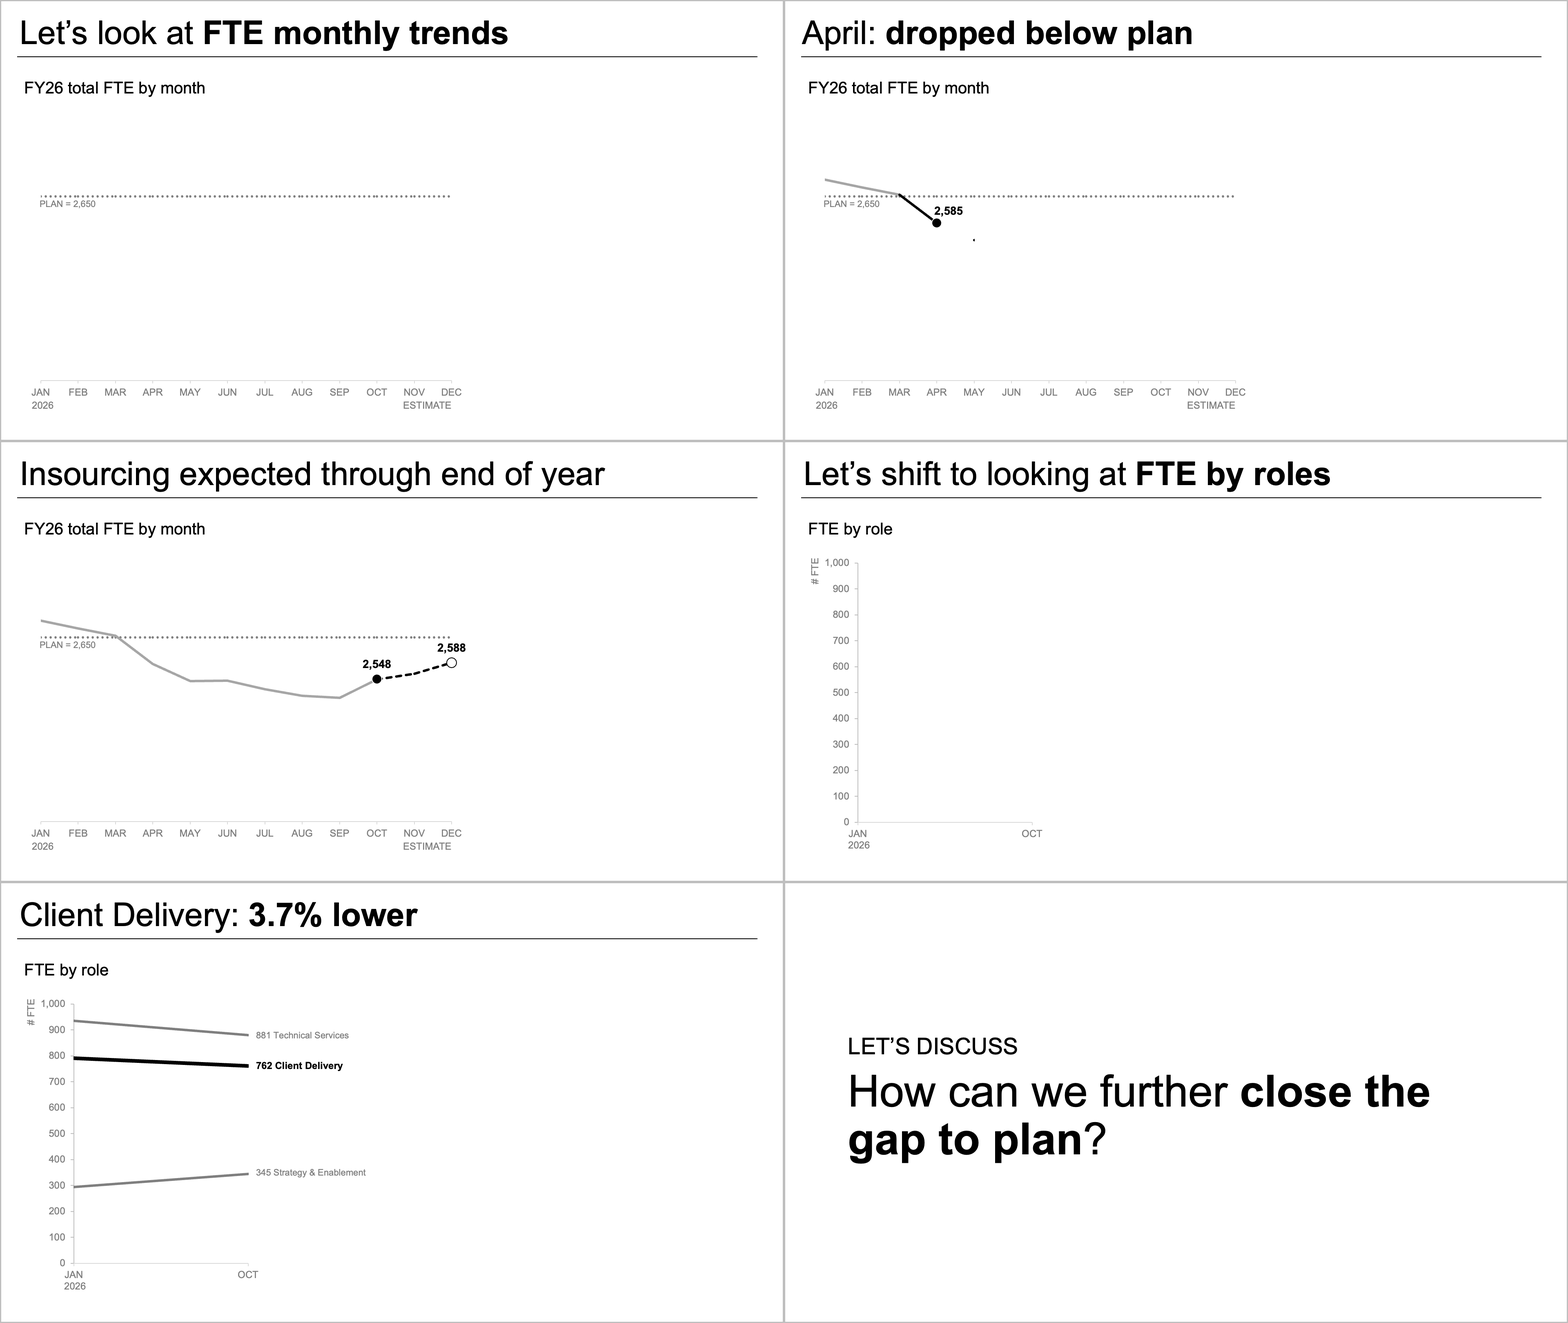
By separating the macro-level FTE trend from the granular, role-level changes, both critical insights become immediately accessible. Together, these two targeted charts deliver a clear, focused narrative that gives leadership the actionable clarity they need to move forward.