When an expected staffing shortfall looms on the horizon, bringing the issue to executive leadership is an essential step for any operational team. However, a high-level forecast alone rarely paints a complete picture. It does not automatically explain where the underlying gap is originating, nor does it immediately point to the specific departments or roles driving the change. When organizations face the challenge of communicating these intricate workforce dynamics, the temptation to squeeze every available data point into a single, comprehensive chart can be overwhelming.
This exact hurdle recently took center stage during a custom client workshop hosted by Storytelling with Data. The participating team faced a multifaceted communication challenge. They needed to convey several critical realities to their leadership group: first, that full-time equivalent (FTE) staffing levels were projected to fall significantly below the established plan; second, that a noticeable decline in operations support roles constituted an important component of the overall trend; and third, that executives needed to engage in an urgent discussion regarding a strategic approach to bridge the emerging gap.
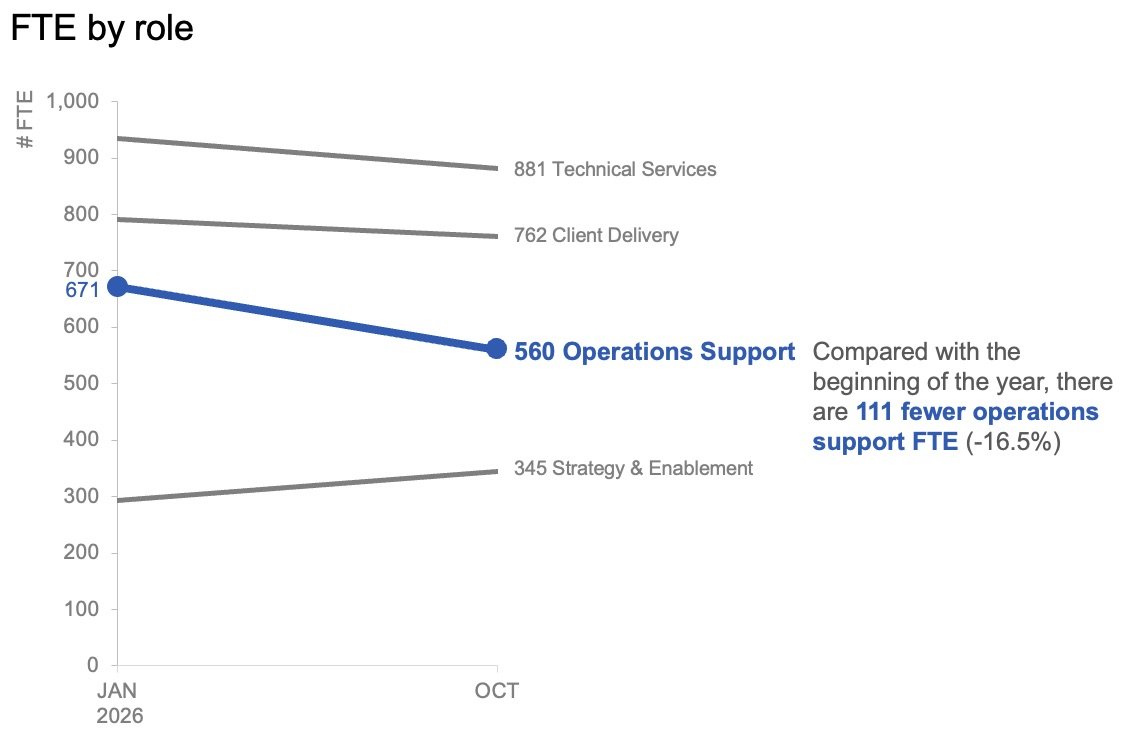
While all the vital information was technically present in their initial reporting materials, the core narrative was effectively buried beneath layers of visual complexity. The original slide asked readers to process multiple competing elements simultaneously. The tops of stacked bars, overlapping trend lines, and an attached data table all attempted to illustrate overall FTE metrics in slightly different ways. Meanwhile, internal segments within the bars attempted to display a granular breakdown by specific job roles, while fluctuating metrics covering plans, actual performance, year-to-date averages, and future projections introduced yet another layer of cognitive load for the audience to interpret.

Each of these visual components addressed a perfectly reasonable and expected question from management. Yet, when crammed haphazardly into a single graph, they undermined each other, making it exceptionally difficult for executives to answer any one question with confidence. Recognizing this friction required taking a step back to evaluate what leadership actually required for the upcoming strategic conversation. Ultimately, executives needed precise answers to two fundamental questions: How severe of a shortfall should the organization anticipate, and what do the most recent staffing data reveal regarding where these workforce shifts have actually occurred?
Rather than continuing to force every nuanced metric into one overcrowded graph, the workshop team explored the effectiveness of separating the information into two distinct views, dedicating one targeted visual to each core question.
Using a Line Chart for the Overall Trend
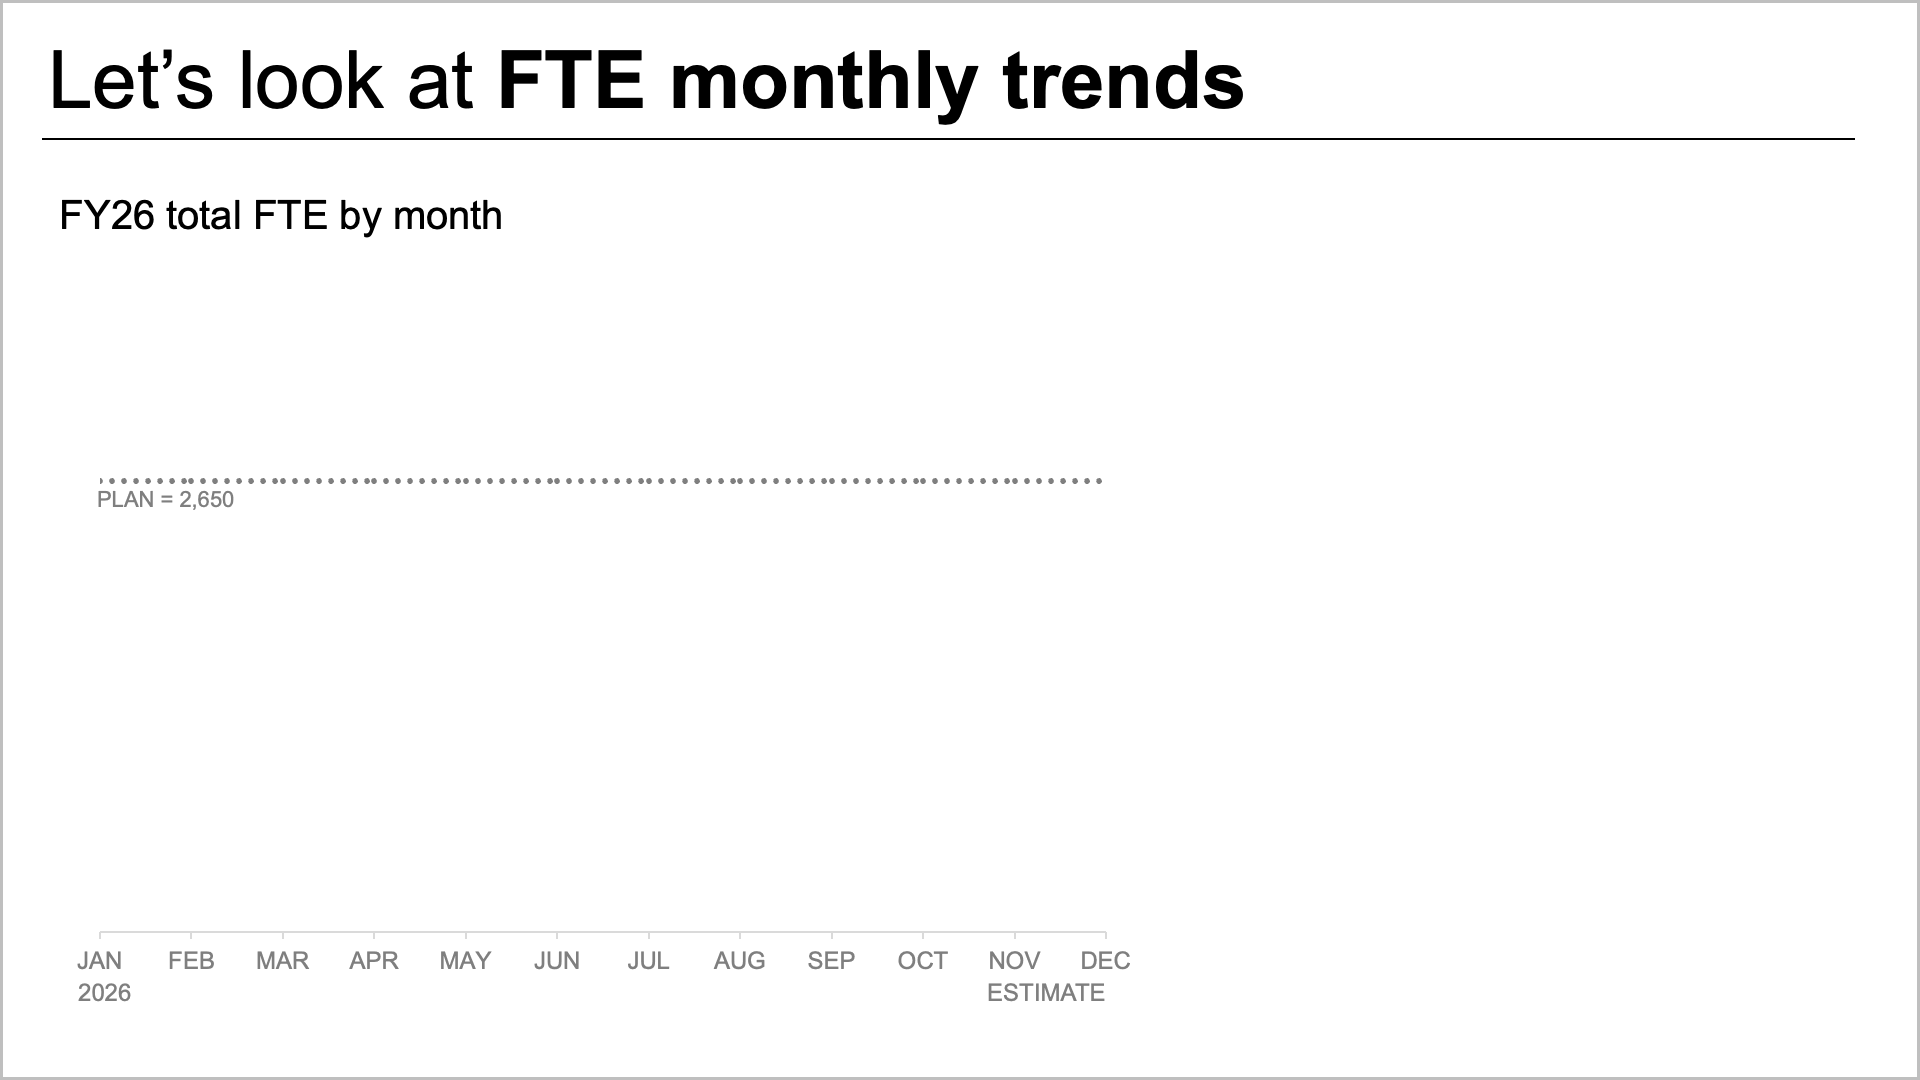
To tackle the anticipated staffing shortfall first, the team shifted away from complex multi-layered graphics in favor of a standalone line chart. This simplified approach immediately made it much easier to track how workforce levels had performed against the original plan established at the beginning of the fiscal year, while also offering a clear look at how future projections compared to those initial targets moving forward.
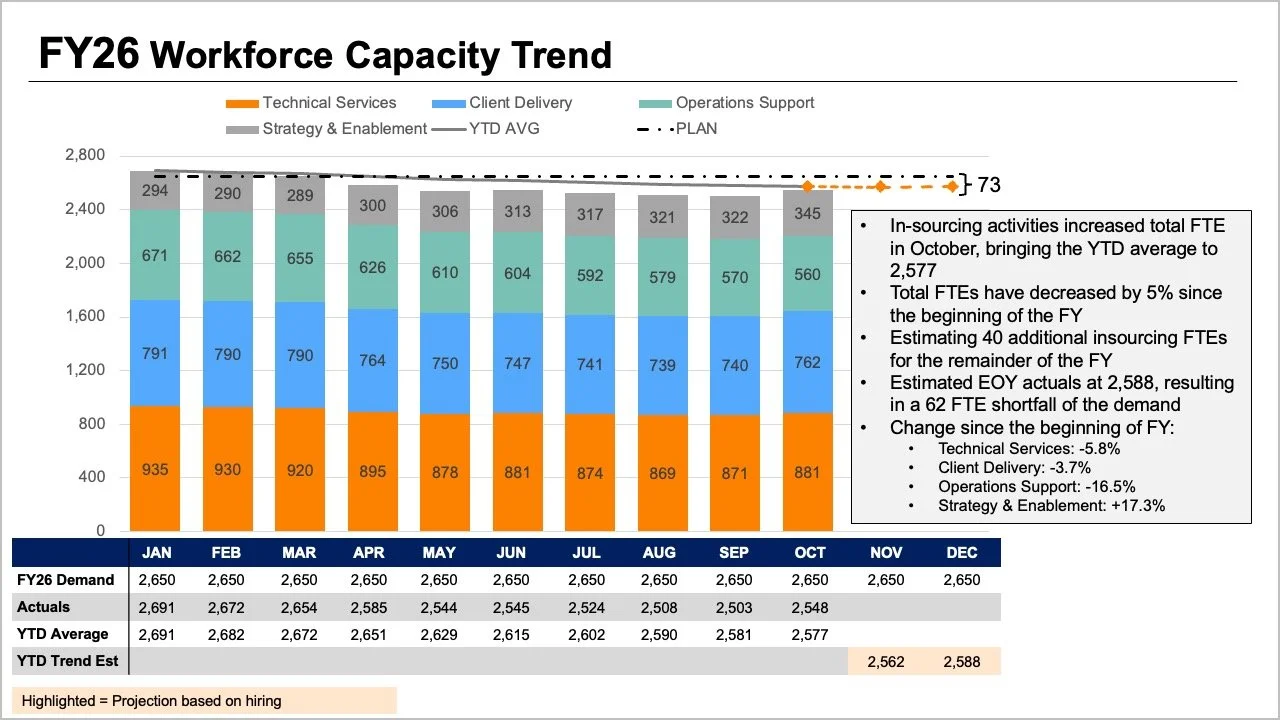
By isolating this specific trend, the layout provided ample negative space to incorporate precise annotations at critical inflection points along the timeline. Consequently, readers were able to focus entirely on the expected gap to plan without first needing to decode a complicated role mix or cross-reference numbers within a dense data table. The overall trajectory of the organization’s workforce became immediately transparent, establishing a solid foundation for the broader conversation about capacity and operational risk.
Adding a Second View for the Role-Level Breakdown
Once the overall macroeconomic view successfully established the expected variance from the annual target, the analysis shifted toward examining role-level changes within the actual data to help illuminate where the largest workforce shifts had materialized. In this context, short-term month-to-month variations proved less critical than understanding the broader directional movement of specific job categories.
To capture this efficiently, the team plotted only the starting point of the year alongside the latest actual month using a slopegraph. This streamlined visualization provided an immediate, intuitive sense of which internal roles had experienced the most substantial changes over the evaluation period. By applying color and contextual text with great restraint, the designers successfully drew the audience’s attention directly toward the decline in operations support roles, enabling stakeholders to spot the most significant operational divergence at a glance.
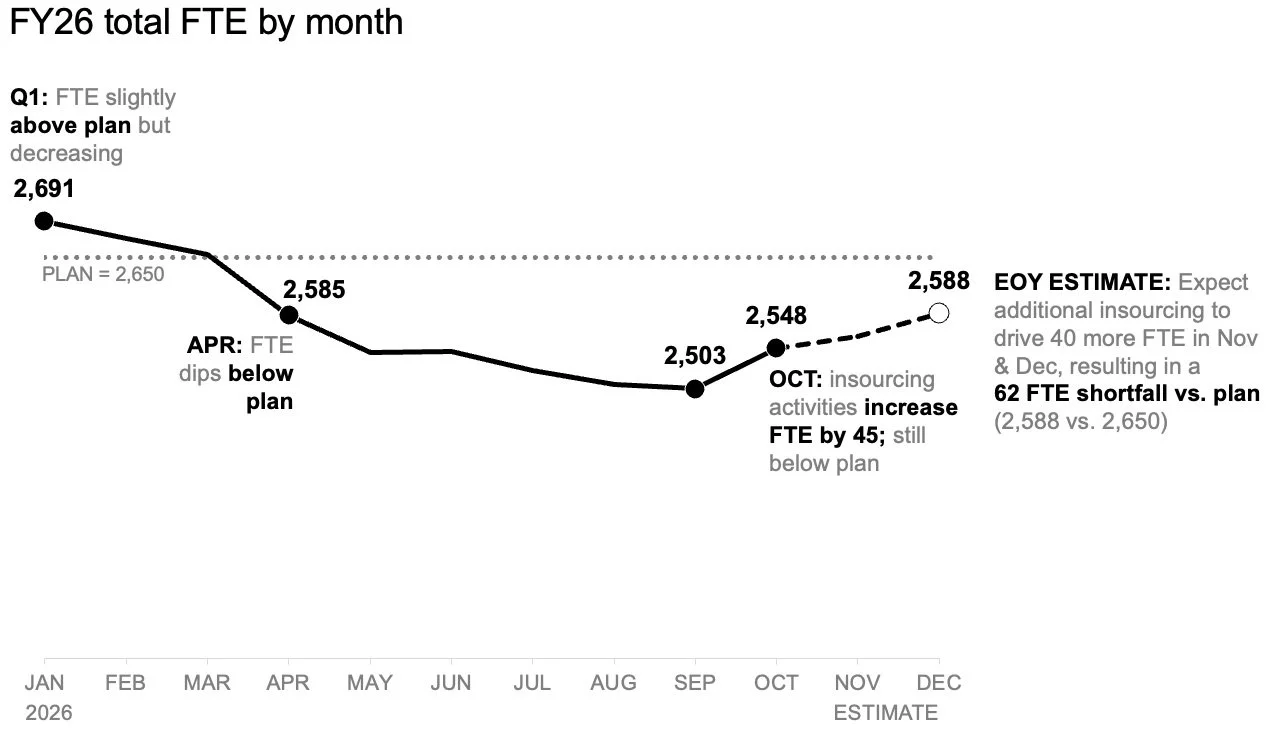
Together, these two visuals functioned as a cohesive pair. The line chart efficiently answered the overarching question of what was happening across the entire organization, while the slopegraph zeroed in on which specific roles had shifted most dramatically up to that point in the year.
Planning for How the Story Will Be Shared
Beyond the design of the charts themselves, the workshop emphasized the importance of tailoring data presentation formats to the specific medium through which they would be consumed. For a static summary report that might be read independently or forwarded across departments without the benefit of a live presenter, placing both visual views together on a single page offered a practical solution. In this layout format, a purposeful slide title explicitly stated the anticipated workforce shortfall, while supporting narrative text directed attention to the decline in operations support roles and signaled the clear need for executive discussion regarding next steps. The accompanying charts supplied the necessary empirical evidence without competing for visual prominence.
Conversely, for a live presentation environment, the workshop demonstrated how the exact same underlying data could be deployed through a more dynamic sequence. Rather than asking an audience to absorb a comprehensive summary all at once while a speaker talked over it, presenters could walk through the overall macro-level forecast first. Following that initial overview, the presentation could reveal the actual role-level changes piecewise, gradually building the narrative before finally steering the discussion toward actionable next steps and strategic decision-making. This deliberate pacing allowed the audience to fully digest one core insight before transitioning smoothly to the next.
While the underlying data and the ultimate core message remained entirely unchanged between the two delivery formats, what shifted was the amount of information the audience was expected to process at any single moment.
Giving Each Question Its Own View
When confronted with complex organizational challenges that demand rich operational detail, data professionals frequently fall into the trap of packing everything into a single, unified view. While this approach can initially feel efficient from a design perspective, the workshop underscored a fundamental rule of data communication: more information on a single slide does not automatically translate to greater understanding for the decision-makers.
By separating the macro-level FTE trend from the granular, role-level shifts, both distinct insights became vastly more accessible. When viewed in tandem, these two thoughtfully designed charts delivered a focused, compelling narrative that provided executive leadership with the clarity required to take decisive, informed action.