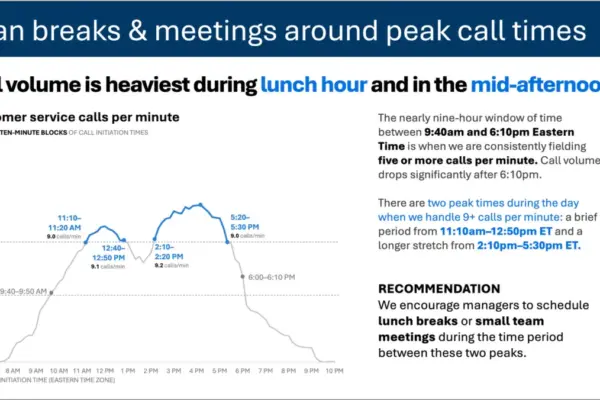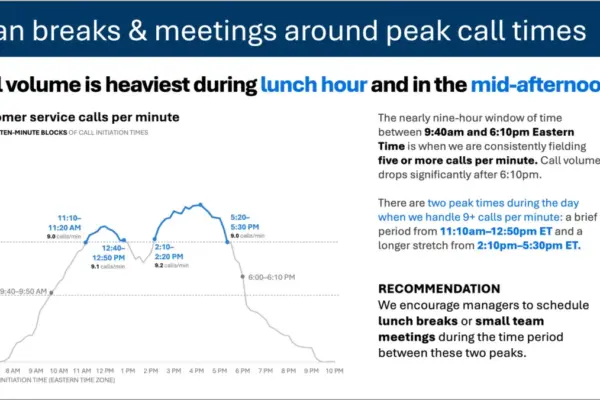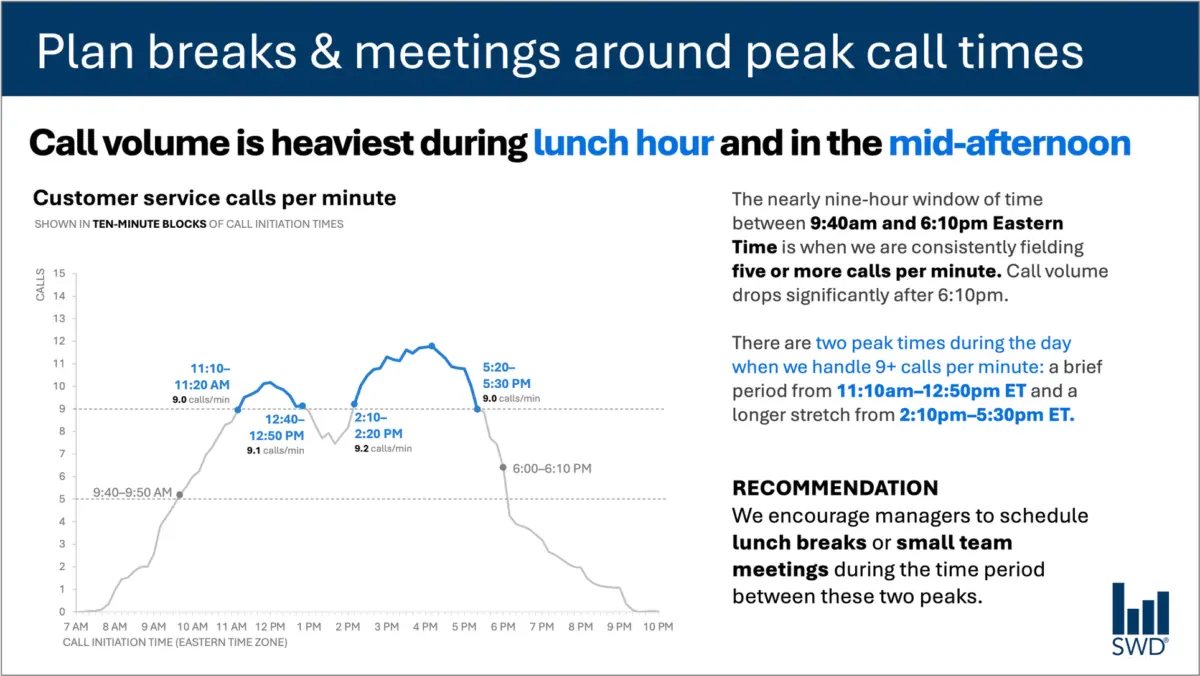
When professionals look at a graph depicting customer service call volume throughout a typical business day, the raw pattern is usually straightforward enough to read. The lines show that calls climb steadily through the morning hours, remain consistently high across much of the standard workday, and spike sharply around lunch and again in the mid-afternoon.
Viewed in isolation, this visualization simply presents a chronological record of customer activity. But the core challenge of data communication rarely lies in whether an audience can trace a trendline. In a professional setting, the people looking at that graph are rarely casual observers motivated by idle curiosity. They are staffing managers, operations leads, and resource planners who need to make operational decisions. Presenting this information implies that they can—and should—do something concrete with it.
That realization fundamentally shifts how text should interact with visual data. It changes the words a communicator chooses, moving the goal from mere visual minimalism to functional clarity.
Consider how text transforms a standard operational slide. A directive takeaway title—such as a prompt to plan breaks and meetings around peak call times—tells staffing managers precisely what matters most. Meanwhile, a descriptive graph title, like customer service calls per minute, provides immediate orientation about the underlying metric. Strategic annotations identify the exact moments when call volume crosses critical operational thresholds, offering essential context about the two distinct peak periods. Finally, a clear recommendation translates the visual evidence into a specific, actionable directive, such as scheduling lunch breaks or small team meetings exclusively between the peaks.
Every element of text in this scenario performs a distinct job. This division of labor underscores a critical principle in professional presentations: communicators sometimes treat reducing words as an absolute virtue, operating under the assumption that fewer words are inherently better. They rarely are. Stripping away all the surrounding text to achieve a stark, minimalist slide might look clean, but it ultimately sacrifices utility. Adding the right words, carefully chosen for their specific function, is what transforms raw data into effective communication.
Different Words Do Different Jobs
Deciding which words belong on a graph or a presentation slide requires an upfront assessment of what the audience actually needs to function effectively. Every textual component on a page carries a distinct responsibility.
A takeaway title communicates the core message or the primary action required by the circumstances. A descriptive graph title anchors the audience, orienting them to the data they are examining without forcing them to guess. Direct labels embedded within the visual can eliminate the tedious friction of referring back and forth between data points and a separate legend. Annotations explain historical anomalies, draw attention to critical inflection points, and introduce qualitative context that cannot be gleaned from quantitative data alone. Supporting elements like axis titles, footnotes, and source information supply the granular detail required for rigorous scrutiny when necessary.
Not every visualization requires every single one of these textual layers. The overriding objective is deliberate design. Communicators must continually ask what their audience requires to truly understand a graphic, what those viewers should know or do as a result of seeing it, and where a few well-chosen words could eliminate confusion or make a central point unmistakable. Once those needs are met, the extraneous words that fail to add value can be safely discarded.
The Insight Has to Come from Somewhere
This strategic nuance highlights why the human element remains irreplaceable, even as organizations increasingly incorporate artificial intelligence into their daily workflows.
Imagine feeding complex call-volume data into an AI system and instructing it to generate a polished slide. The technology can readily identify the overarching pattern. It can accurately report that call volume peaks around lunchtime and during the mid-afternoon, and it can effortlessly draft a well-written, grammatically correct sentence describing that observation.
Yet, a descriptive sentence is not yet an insight.
A truly useful recommendation emerges only when raw data is synthesized with broader contextual knowledge. Who is the target audience? Why are they reviewing this particular graphic? What operational pressures do they care about, and which decisions genuinely fall within their control? Once a communicator establishes that the audience consists of staffing managers, a standard statistical pattern transforms into an actionable operational strategy.
This dynamic forms the core rationale behind modern data storytelling frameworks, which emphasize that users must supply context before asking technology to assist with communication. Artificial intelligence can undoubtedly help refine phrasing, suggest concise titles, draft descriptive labels, and test various ways of articulating a core concept. However, a human operator must still understand the underlying business situation well enough to recognize what truly matters.
A polished sentence and a genuine insight are fundamentally different things. Professionals who have spent extended periods working directly with a dataset possess a deep institutional memory that algorithms simply cannot replicate. They know the historical context, understand what operational changes occurred last quarter, and grasp the broader organizational goals that dictate audience priorities. An experienced analyst might recognize that one minor movement in a graph is an emergency caused by a known system outage, while another seemingly prominent spike is a routine daily fluctuation that requires no intervention at all.
Effective communicators bring that nuanced institutional knowledge directly to their slides, using carefully chosen words to make their strategic thinking visible to stakeholders. The ultimate goal is never about maximizing or minimizing word counts. It is about finding the right words, placed in the right locations, doing the right jobs.