In the modern corporate and analytical landscape, professionals are frequently told that when it comes to presenting data, less is almost always more. Slides should be stripped down, clutter must be relentlessly eliminated, and whitespace should dominate the canvas in the pursuit of a clean, minimalist aesthetic. But a growing perspective in data storytelling suggests that this pursuit of barebones minimalism can sometimes strip a presentation of its actual utility.
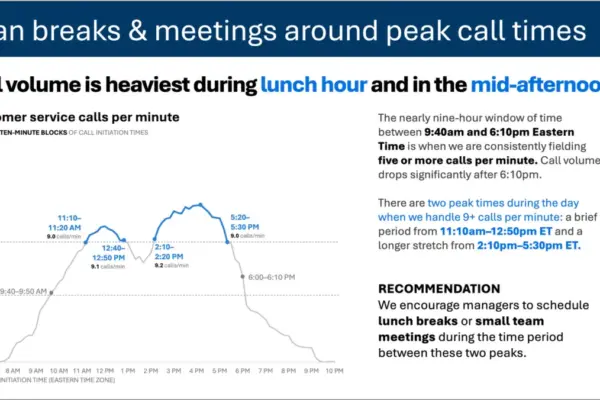
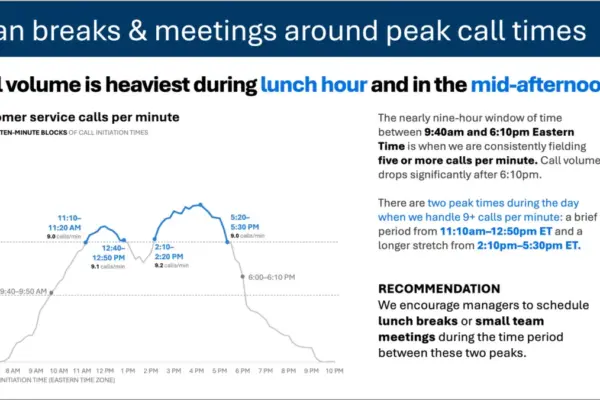
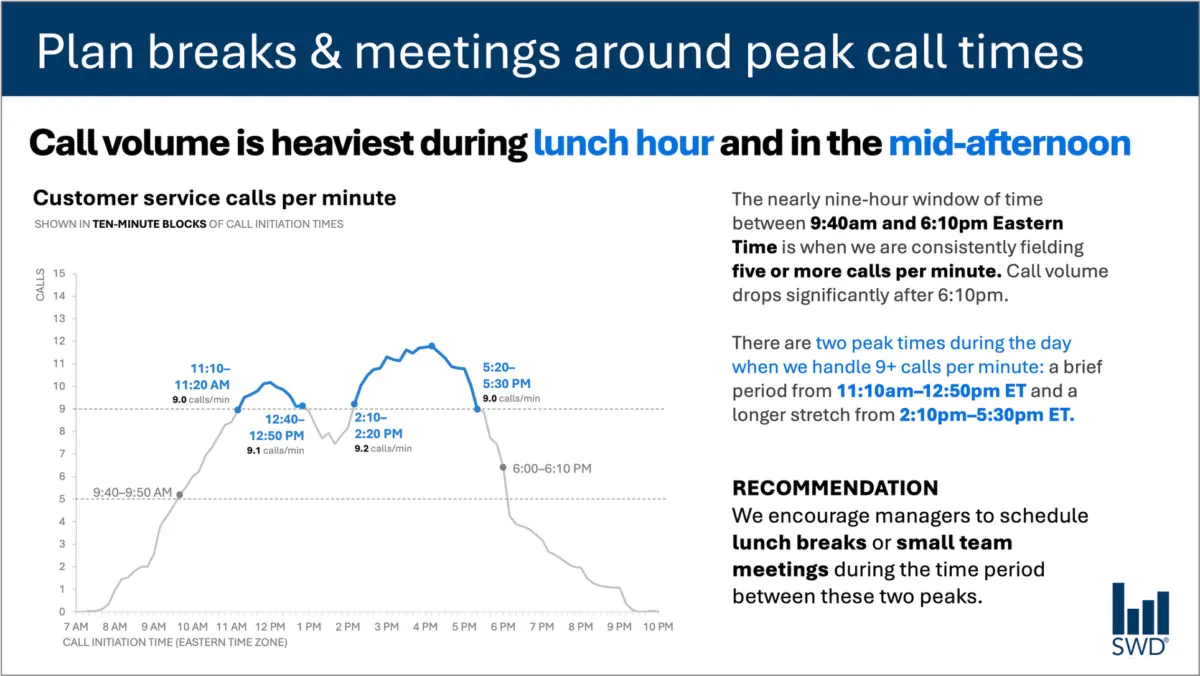
Consider a standard line graph mapping customer service call volume over the course of a business day. Viewed in isolation, the visual pattern is straightforward and easy to interpret: call volumes steadily climb through the morning hours, remain elevated across the bulk of the standard workday, and surge into distinct peaks around the lunch hour and again later in the afternoon.
On its own, this chart presents a clear narrative of operational rhythm. However, audiences rarely look at enterprise data purely out of idle curiosity. The people viewing this specific chart are typically staffing managers, operational planners, and customer support leads. The underlying reason for presenting this data to them is not simply to inform them that lunch is busy, but rather because they possess the operational authority and responsibility to do something meaningful with that information.
That single shift in context fundamentally alters how every piece of text on the page should be chosen, structured, and deployed.
When addressing staffing managers, a chart requires more than a generic label. A well-designed takeaway title can immediately frame the core message or direct an actionable decision, such as urging planners to schedule team meetings and staff breaks around predicted peak call times. Meanwhile, a precise descriptive graph title—such as customer service calls per minute—orients the viewer to the exact metric being evaluated. Thoughtfully placed annotations identify the precise moments when call volume crosses critical operational thresholds, providing vital context about the nature of those two demanding peak periods. Finally, a clear, targeted recommendation translates raw statistical lines into a tangible administrative action: scheduling lunch rotations and small team syncs during the lull periods between the peaks.
Every single element of text on a successful data slide has a specific, defined job to perform. The prevailing corporate obsession with reducing word counts as though a lower number is inherently superior can often backfire. Removing all surrounding text from a complex operational graph might yield a sleek, minimalist slide, but it frequently sacrifices the clarity and practical utility required by decision-makers. Achieving true impact requires adding the right words to ensure effective communication, rather than blindly slashing text in the name of aesthetic reduction.
Different Words Do Different Jobs in Data Design
When analysts and designers decide which words belong on a graph or presentation slide, the process should begin with a fundamental question regarding audience needs. Every text component serves a distinct structural and cognitive purpose within the broader visual narrative.
A takeaway title communicates the core takeaway or required action, sparing busy managers from having to dig through raw numbers to find the underlying message. A descriptive graph title establishes context, ensuring the audience immediately understands the parameter being measured. Direct labels eliminate the visual fatigue of forcing viewers to constantly scan back and forth between the primary graphic and a distant legend. Annotations explain historical anomalies, draw attention to critical inflection points, and add qualitative context that remains completely invisible in the raw numerical data alone. Meanwhile, foundational elements like axis titles, footnotes, and source citations provide the necessary depth and verification when granular detail is required.
Crucially, not every chart or data visualization requires every single one of these components. The ultimate objective is deliberate design. Communicators must evaluate what their audience requires to comprehend the information instantly, what those stakeholders should know or do as a direct result of viewing the slide, and where a few carefully chosen words can eliminate ambiguity or make the analytical point unmistakable. Once those priorities are established, any extraneous words that fail to advance understanding can be safely discarded.
The Critical Gap Between Raw Data and True Insight
This intersection of data, audience intent, and communication design highlights why the human element remains irreplaceable, even as organizations increasingly turn to artificial intelligence to draft presentations and summarize analytical reports.
Imagine feeding complex call-volume datasets into an advanced artificial intelligence system and instructing it to generate a polished slide layout. The technology can readily analyze the numerical patterns, identify diurnal trends, and note that call volumes peak around lunchtime and mid-afternoon. It can effortlessly synthesize those observations into a grammatically polished sentence describing the trend.
Yet, that accurate description falls short of being a true operational insight.
Valuable, actionable recommendations only emerge when raw data is synthesized with external organizational context. An AI model, on its own, does not inherently know who is sitting in the audience, why they are reviewing the metric, what organizational pressures they face, or which operational decisions fall within their direct control. Once a human designer establishes that the audience consists of staffing managers responsible for shift scheduling, a routine statistical pattern transforms into an actionable roadmap.
This distinction forms a core pillar of modern data storytelling frameworks, such as specialized guidance encouraging professionals to provide AI with comprehensive contextual parameters before asking for communication support. Artificial intelligence can undoubtedly assist with drafting concise phrasing, suggesting descriptive titles, testing alternative ways to articulate a concept, or refining label placements. However, human expertise is still required to understand the operational environment well enough to recognize what truly matters.
A polished sentence generated by an algorithm is simply not the equivalent of human insight forged through experience. Professionals who have spent extended periods working directly with specific datasets possess institutional knowledge that technology cannot replicate. They understand the corporate history, recall what procedural changes triggered a sudden surge in inquiries, and recognize the subtle organizational nuances that dictate what the audience actually cares about. An experienced analyst might recognize that a minor upward blip on a graph is an emergency signaling a systemic failure, while another movement that appears visually prominent on the chart is merely a routine daily fluctuation.
Bringing that deep contextual knowledge to the presentation layer allows professionals to use words to make their strategic thinking visible to stakeholders. The ultimate goal in professional data communication is never simply to maximize or minimize word counts. Success lies entirely in selecting the right words to perform the right jobs, bridging the gap between raw data and meaningful organizational action.