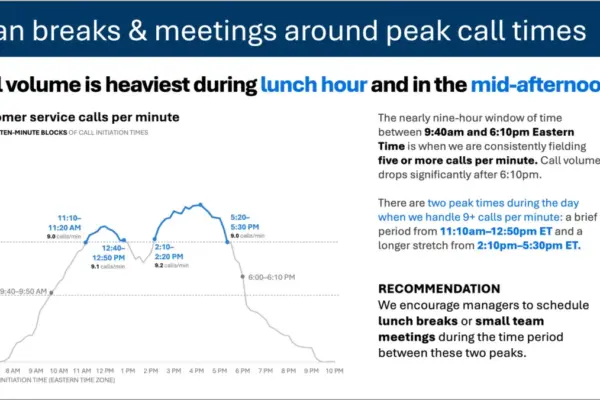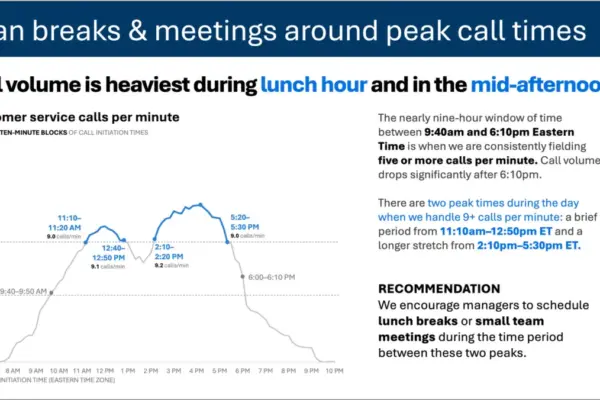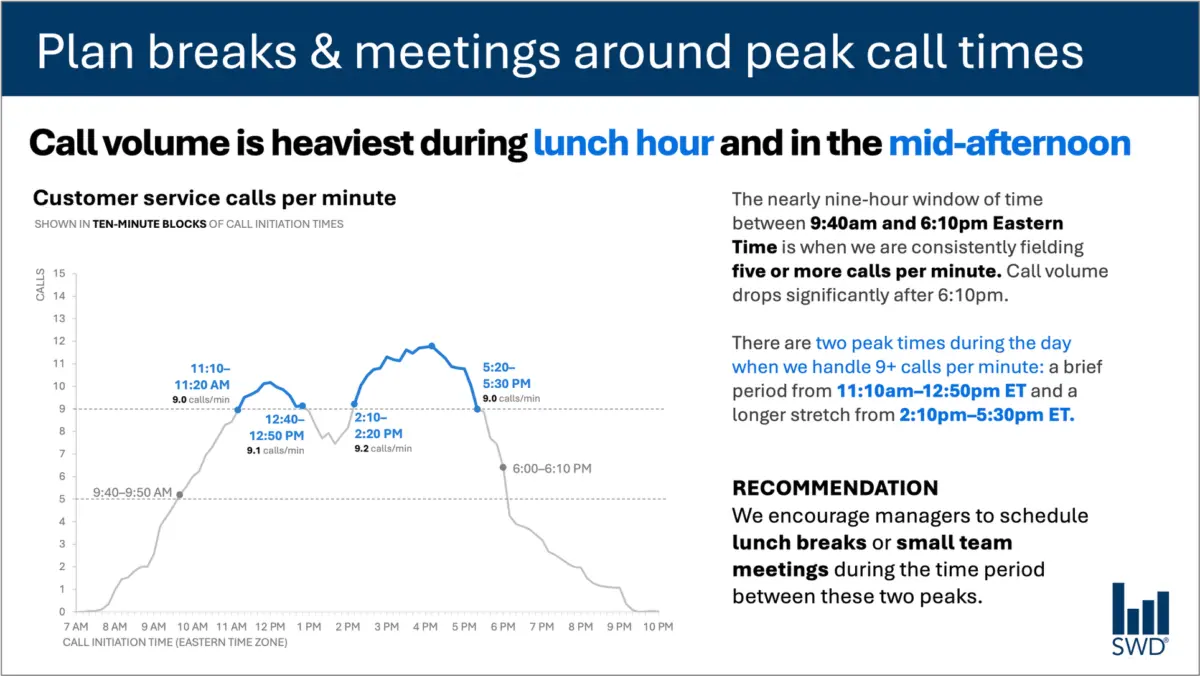
When professionals look at a graph depicting customer service call volume throughout a standard workday, the initial visual patterns are often immediately apparent. Calls begin to climb steadily in the morning hours, remain consistently high across the duration of the core workday, and ultimately reach distinct peaks around lunchtime and again during the mid-afternoon.
Viewed in a vacuum, the data merely presents a chronological trend. However, when the audience consists of staffing managers—individuals whose primary responsibility is to ensure adequate workforce coverage while managing labor costs—the function of the visualization changes entirely. The presence of this audience implies that the data is not being presented simply to satisfy idle curiosity about call patterns; rather, it is being shared because those viewers are in a position to take meaningful operational action based on what they see.
This fundamental shift in audience context directly influences the textual elements required to make the data effective. A bare visualization fails to bridge the gap between raw numbers and operational reality. By thoughtfully structuring the surrounding text, communicators can transform a standard line chart into a clear call to action. For instance, pairing the data with a deliberate takeaway title such as "Plan breaks and meetings around peak call times" immediately signals to staffing managers what matters most in the analysis. Meanwhile, a descriptive graph title like "Customer service calls per minute" grounds the viewer by explicitly stating what they are looking at, while annotations pinpoint the exact moments call volumes cross critical operational thresholds and provide necessary context regarding the two distinct daily peaks. Finally, a targeted recommendation translates these insights into a concrete administrative strategy, suggesting that lunch breaks and small team meetings be scheduled precisely between the high-volume peaks.
Each component of text on a well-designed slide serves a specific, deliberate purpose. This principle challenges a common misconception in corporate and analytical communications that reducing word count is inherently beneficial. While removing all surrounding text from a visual artifact unquestionably makes a slide more minimalist, it does not inherently make it more useful. Stripping away context often leaves the audience to decode the implications of the data independently, increasing the risk of misinterpretation or inaction. Effective communication relies not on arbitrary brevity, but on the inclusion of the right words placed purposefully to guide understanding.
Different Words Do Different Jobs
When deciding which textual elements belong on a graph, slide, or report, communicators must first evaluate what their specific audience requires from the material. Different types of text perform distinct communicative functions within a single visual presentation.
A takeaway title is designed to communicate the main analytical point or direct the audience toward a necessary action. Conversely, a descriptive graph title serves an orienting function, ensuring that viewers immediately understand the parameters of the data they are examining. Direct labels integrated into the visual can eliminate the cognitive friction of repeatedly shifting one’s eyes back and forth between the data series and a separate legend. Furthermore, annotations provide narrative depth by explaining unusual events, drawing attention to critical anomalies, or adding organizational context that cannot be derived from the raw numbers alone. Supporting elements such as axis titles, footnotes, and source citations provide the necessary granular detail for stakeholders who require a deeper dive into the methodology.
Importantly, not every graph or data visualization requires the full array of textual elements. The overarching objective is intentionality. Communicators must continually assess what their audience needs in order to comprehend the material, what they should know or do as a direct result of viewing the information, and where a few well-chosen words could eliminate ambiguity or make the core message unmistakable. Once those priorities are established, any extraneous words that fail to advance the communicative goal can be safely eliminated.
The Insight Has to Come From Somewhere
This distinction between raw data description and actionable intelligence highlights the irreplaceable role of human expertise, particularly in an era where artificial intelligence tools are increasingly utilized to generate analytical content.
Consider a scenario where customer service call-volume data is fed into an artificial intelligence system with instructions to generate a slide presentation. An AI model is fully capable of identifying the underlying mathematical patterns within the dataset. It can accurately deduce that call volume reaches its highest levels around the noon hour and again during the mid-afternoon, and it can subsequently synthesize these observations into a polished, grammatically correct sentence.
However, a polished descriptive sentence does not automatically constitute an actionable insight.
The formulation of a truly useful recommendation requires combining raw data with external context that an AI system cannot independently infer. This process demands answers to fundamental questions: Who is the specific audience? Why are they viewing this information? What do they genuinely care about? Which decisions fall directly within their administrative control? Once it is established that the audience comprises staffing managers, the observed chronological pattern transforms from a mere descriptive statement into an actionable operational directive.
This principle forms the cornerstone of modern data storytelling frameworks, which emphasize the necessity of providing artificial intelligence with comprehensive contextual background before asking it to assist in communication tasks. While AI remains a powerful assistant for refining phrasing, suggesting alternative titles, drafting labels and annotations, and testing different narrative structures, human oversight remains vital. A human professional must still understand the operational environment well enough to recognize what truly matters to the organization.
A polished sentence and a genuine insight are fundamentally distinct. Professionals who have spent extended time working directly with organizational data possess institutional knowledge that technology lacks. They understand the historical background, recognize what operational changes have recently occurred, and grasp the broader organizational culture and audience sensitivities. A seasoned analyst may recognize that a minor fluctuation in a graph is actually a critical indicator of a systemic issue, whereas a prominent swing in another metric may be an expected seasonal artifact.
Bringing that specialized knowledge into the analytical process allows communicators to use words to make their strategic thinking visible to stakeholders. The ultimate goal in data presentation is neither maximizing nor minimizing word count, but rather selecting the right words to execute the right jobs, ensuring that data successfully translates into understanding and action.