In the modern corporate landscape, data visualization has increasingly become the bedrock of operational decision-making. Yet, a fundamental tension persists between aesthetic minimalism and functional communication. When professionals present data—whether on a slide, in a report, or through a digital dashboard—there is a frequent temptation to strip away surrounding text in pursuit of a clean, uncluttered look. However, industry communications experts argue that this minimalist impulse often undermines the primary purpose of data presentation: driving action.
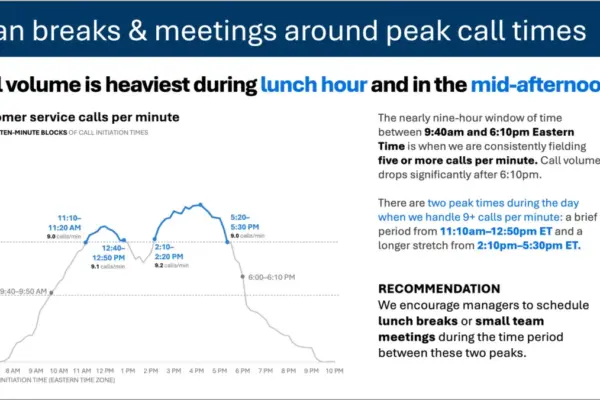
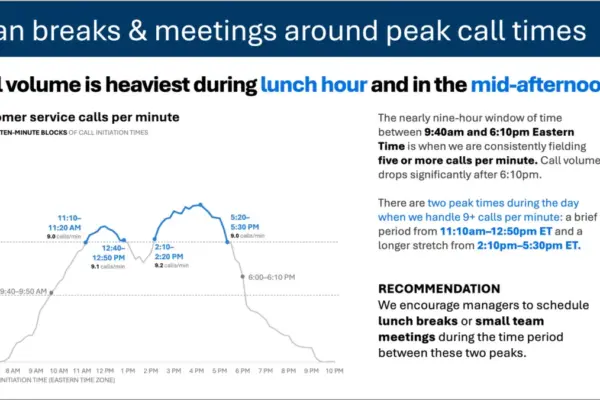
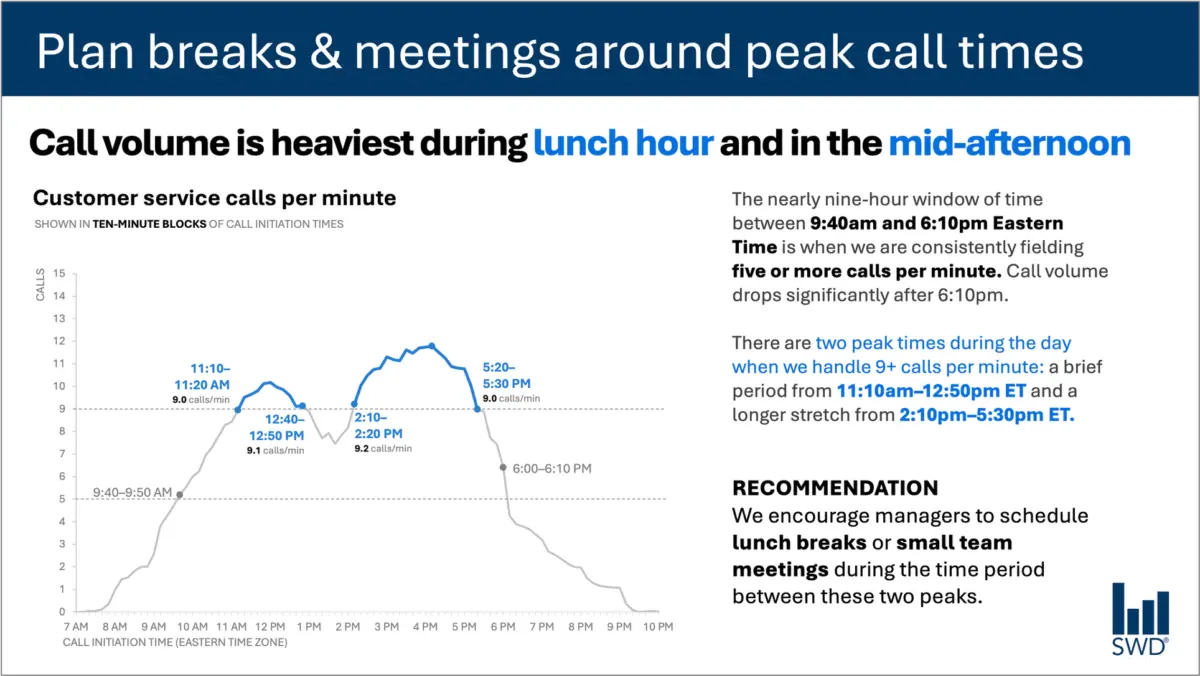
Consider a standard line graph mapping customer service call volume throughout a typical business day. Viewed in isolation, the chart reveals a clear, predictable pattern. Call volumes steadily climb during the morning hours, remain consistently high through much of the core workday, and surge into distinct peaks around lunchtime and again in the mid-afternoon.
On a purely analytical level, the pattern is self-evident. But data rarely exists in a vacuum, and audiences rarely view charts out of sheer idle curiosity. When the audience consists of staffing managers, the fundamental nature of the visualization changes entirely. These professionals are not examining the data to admire a trend line; they are looking at it because they have the power—and the responsibility—to act upon it. They need to manage workforce capacity, schedule breaks, and optimize operational efficiency.
This vital context fundamentally alters the strategic deployment of text. When designing a slide for staffing managers, the inclusion of deliberate, purposeful language transforms raw data into an operational roadmap.
For instance, a strategic takeaway title placed at the top of the presentation—such as "Plan breaks and meetings around peak call times"—immediately informs staffing managers what matters most. Meanwhile, a precise descriptive graph title, like "Customer service calls per minute," grounds the audience and clearly identifies the exact metric they are evaluating.
Furthermore, targeted annotations can be integrated to pinpoint the exact moments when call volumes cross critical operational thresholds, offering essential context regarding the nature of the two daily peaks. Finally, a clear, actionable recommendation translates the visual evidence into a concrete directive: schedule lunch breaks and small team meetings specifically during the lulls between the peaks.
Every single piece of text on the page or screen has a distinct job to fulfill. This realization challenges the prevailing wisdom that reducing word count is universally beneficial. Stripping away all surrounding context to achieve a minimalist design might result in a visually sparse slide, but it ultimately diminishes the utility of the communication. Effective communication requires adding the right words in the right places to ensure the message resonates and drives the desired outcome.
Different Words Do Different Jobs
When deciding which words belong on a graph, dashboard, or presentation slide, communicators must first analyze what the audience actually requires to interpret and leverage the information. Different textual elements serve entirely distinct functions within a visual layout.
A takeaway title communicates the core point or the required action, bridging the gap between observation and implementation. A descriptive graph title, on the other hand, roots the audience in the data, ensuring they immediately understand what they are looking at without second-guessing the metrics. Direct labels can eliminate the cognitive friction of scanning back and forth between the data series and a separate legend.
Annotations play a critical role by explaining what actually happened during specific anomalies, drawing the eye to important inflection points, or adding qualitative context that remains entirely invisible within the quantitative data alone. Meanwhile, traditional elements such as axis titles, footnotes, and source information provide the necessary depth and credibility when secondary details are required for verification.
Crucially, not every graph requires every single one of these textual layers. The overarching goal is deliberate intent. Communicators must ask themselves what the audience genuinely needs to comprehend the visual, what they should know or do as a direct result of viewing it, and where a few well-chosen words could eliminate ambiguity or make the central insight unmistakable.
Once those functional elements are established, the remaining extraneous text that fails to add value can be discarded. The objective is not brevity for its own sake, but precision.
The Insight Has to Come From Somewhere
This delicate balance between data and narrative highlights why the human role remains irreplaceable, particularly in an era of rapidly advancing artificial intelligence tools designed to automate content creation.
Imagine feeding complex call-volume data into an advanced AI model and instructing it to generate a presentation slide. The technology would almost certainly succeed in identifying the underlying pattern. It could readily analyze the numbers and output a polished, grammatically correct sentence noting that call volume consistently peaks around lunchtime and once again in the mid-afternoon.
Yet, a polished description does not automatically constitute a genuine insight.
True actionable recommendations require a synthesis of raw data with external context that an algorithm cannot inherently deduce. Who is the actual audience? Why are they reviewing this specific dataset? What do they genuinely care about, and what decisions fall directly within their sphere of control? Once a human designer establishes that the audience is comprised of staffing managers, the data pattern shifts from a passive observation into an active operational directive.
This principle forms the cornerstone of modern data storytelling frameworks, which emphasize the necessity of providing AI with comprehensive contextual framing before asking for assistance with communication tasks. Artificial intelligence can undoubtedly aid in finding concise phrasing, suggesting alternate titles, drafting descriptive labels, or testing various ways to articulate a complex concept. However, a human operator must still understand the real-world situation thoroughly enough to recognize what truly matters.
A polished sentence and a strategic insight are two entirely different deliverables. Professionals who have spent extended periods working closely with specific datasets possess institutional knowledge that algorithms simply lack. They know the historical background of the organization, they understand what operational changes occurred last quarter, and they are acutely aware of what leadership and stakeholders prioritize. Furthermore, human analysts can instantly recognize that a minor fluctuation in a graph is actually a consequential market shift, whereas another visually prominent spike might be an irrelevant statistical anomaly.
Translating data effectively means bringing that experiential knowledge directly to the presentation slide. Professionals must use words as tools to make their underlying analytical thinking visible to others. Ultimately, the objective of data storytelling is never about maximizing or minimizing word counts; it is about deploying the right words to do the right jobs.