That exact communication hurdle took center stage during a recent custom client workshop hosted by data storytelling specialists, where a corporate team grappled with how to present a nuanced workforce update to top executives. The organization was facing a multifaceted human resources challenge: full-time equivalent (FTE) staffing levels were projected to fall significantly below the established operational plan, a notable decline in operations support roles was driving a major share of the variance, and executive leadership urgently needed to deliberate on a strategic approach to resolve the widening gap.
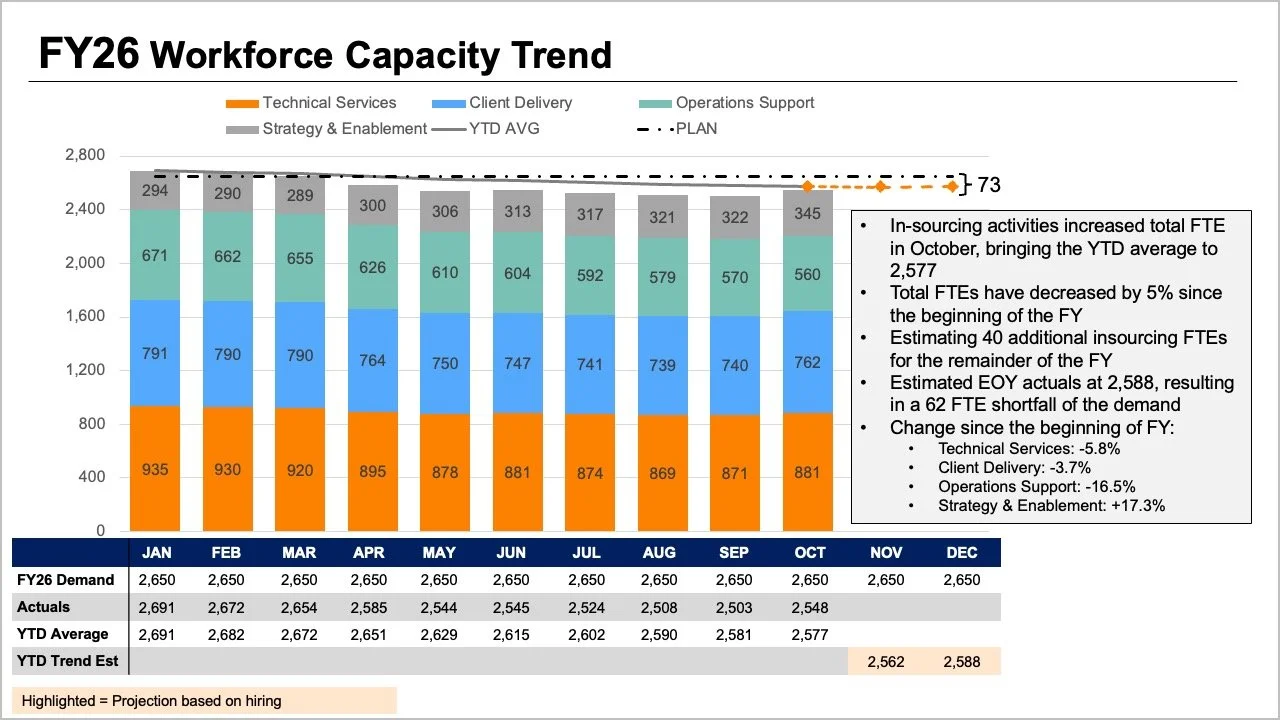
While all the critical data and context were present in the team’s initial reporting materials, the core narrative was effectively buried beneath layers of visual complexity. The original presentation slide asked readers to process multiple competing elements simultaneously, creating cognitive overload. The tops of stacked bars, separate trend lines, and an attached data table all attempted to convey overall FTE metrics in slightly different ways, while individual segments within the bars mapped out a granular breakdown by specific job roles. Adding to the interpretive burden, the graphic jammed together planned figures, actual figures, year-to-date averages, and forward-looking projections onto the same canvas.

Each individual element within the crowded graphic attempted to answer a reasonable business question, but when crammed together into a single view, they made it exceptionally difficult for leadership to digest any single insight well. Stepping back to evaluate what executives actually required for the upcoming strategic discussion revealed a more effective path forward. Leaders fundamentally needed answers to two distinct questions: how large of a staffing shortfall should the organization realistically expect, and what did the most recent workforce data indicate about where the structural changes had actually occurred?
Rather than forcing every piece of information into a single, dense graph, the workshop team explored the impact of dividing the narrative into two distinct visuals, dedicating one clear chart to each core question.
Tracking Overall Trends with Clarity
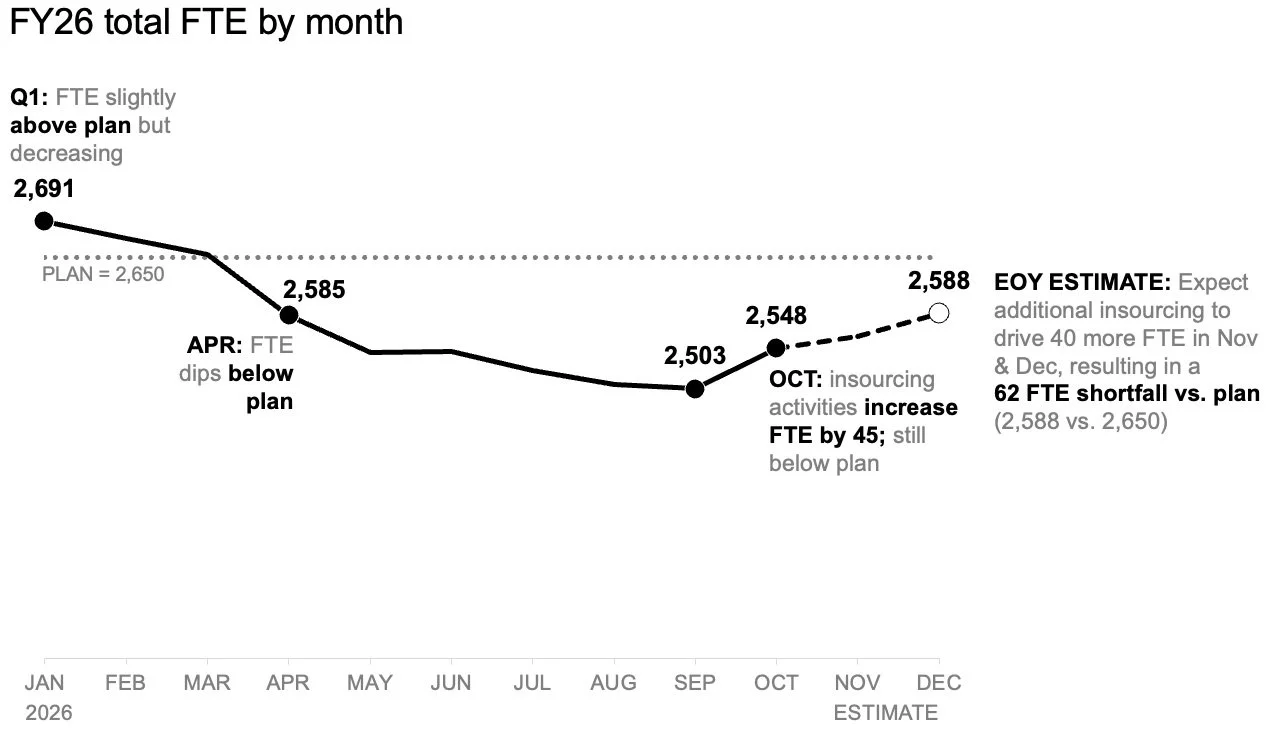
To tackle the anticipated shortfall first, the analysis shifted toward a standalone line chart. This focused view made it significantly easier to observe how staffing levels had tracked against the baseline plan established at the beginning of the year, as well as how future projections compared with that initial trajectory moving forward. By isolating the macro trend, the visual format provided ample open space to incorporate strategic annotations at critical junctures along the timeline. This allowed readers to focus immediately on the expected gap to plan without first having to decode a complex role mix or scan back and forth across a dense supporting table.
Isolating Role-Level Shifts
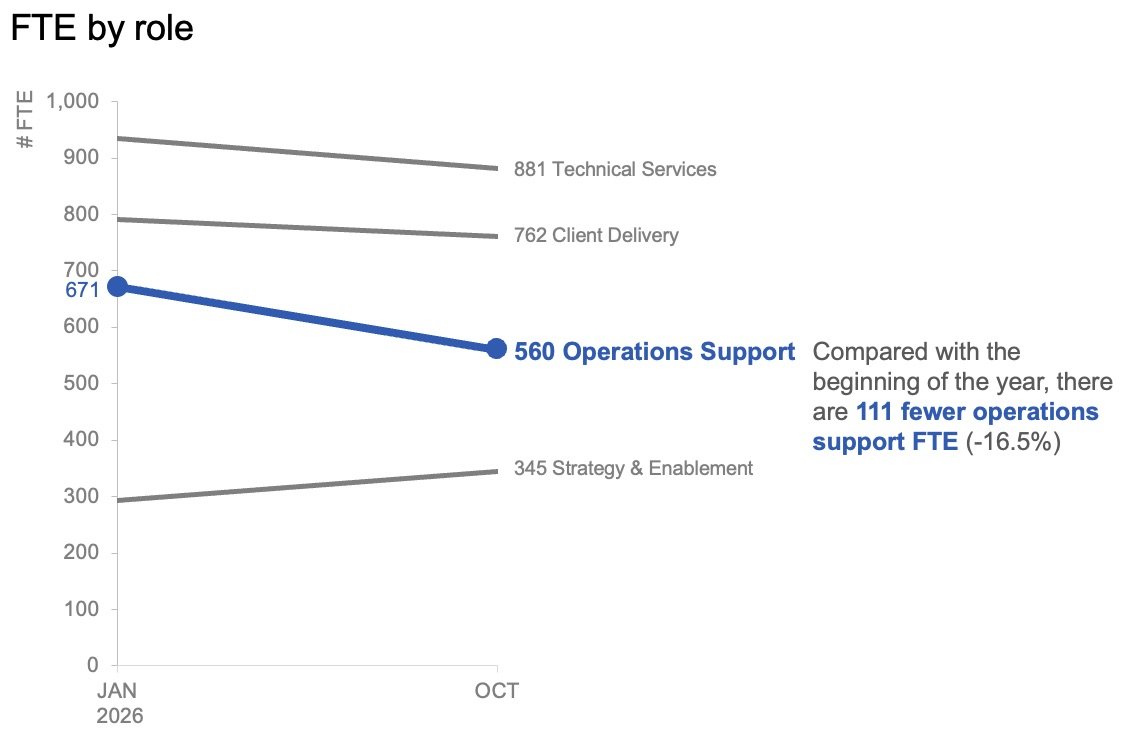
Once the overall trajectory and the expected difference from the beginning-of-the-year target were established, the discussion naturally turned to examining role-level changes in the actual data. Understanding this breakdown was essential for identifying precisely where the largest operational shifts had materialized. For this specific analytical angle, month-to-month operational variation carried less weight than the broader directional shift over time.
By plotting only the starting baseline from the beginning of the year and the latest actual month using a slopegraph, analysts provided leadership with an immediate sense of which specific roles had experienced the most substantial changes. Utilizing color and supporting text with strict restraint successfully drew immediate attention to the distinct decline in operations support roles, helping the audience quickly grasp the primary driver of the variance without unnecessary visual noise.
These two visual artifacts ultimately functioned as a powerful analytical pair. The line chart efficiently addressed the macro-level inquiry regarding overall performance, while the slopegraph answered the more granular question of which specific workforce segments had changed the most during the evaluation period.
Shaping the Narrative for Different Audiences
Recognizing that data presentations occur in varied formats, the approach to sharing this story was tailored to match the specific medium. For a standalone executive summary document that might be reviewed independently or forwarded across leadership channels without a live presenter, placing the two distinct views together on a single page provided a comprehensive overview. In this static layout, an assertive takeaway slide title explicitly stated the expected shortfall, while concise supporting text pointed directly to the decline in operations support roles and signaled the need for executive deliberation on next steps. The paired charts then supplied the necessary empirical evidence without competing for the same visual territory.
For a live presentation setting, however, the same underlying data and core message were delivered through a carefully paced sequence rather than all at once. Rather than asking an audience to absorb a comprehensive summary slide simultaneously while a speaker talked over it, the presentation walked through the macro-level forecast first. It then revealed the actual role-level changes in a step-by-step manner before finally shifting the floor to an open discussion about corrective actions. This intentional pacing allowed the audience to fully absorb one critical concept before transitioning to the next.
While the underlying data metrics and the ultimate business message remained identical throughout both formats, the fundamental variable that changed was the cognitive load placed on the audience at any given moment.
When comprehensive business reviews require deep operational detail, the temptation to consolidate all available metrics into a single view remains strong in corporate environments, driven by a desire for administrative efficiency. However, simply packing more information into a single space does not automatically generate higher levels of understanding or accelerate decision-making. By separating the macro-level FTE trend from the granular, role-level changes, both insights became strikingly easier for leadership to interpret, resulting in a focused, transparent narrative that equipped executives to take decisive action.